BTCI – setting up for a breakout?What is CBOE:BTCI ?
BTCI is the NEOS Bitcoin High Income ETF – a covered-call ETF designed to provide exposure to Bitcoin price trends with monthly income. The fund uses options strategies to generate consistent yields while holding Bitcoin futures and related instruments.
💰 Annual dividend yield: approx. 18%, paid monthly
📆 Ideal for income-focused investors who still want crypto exposure without direct volatility.
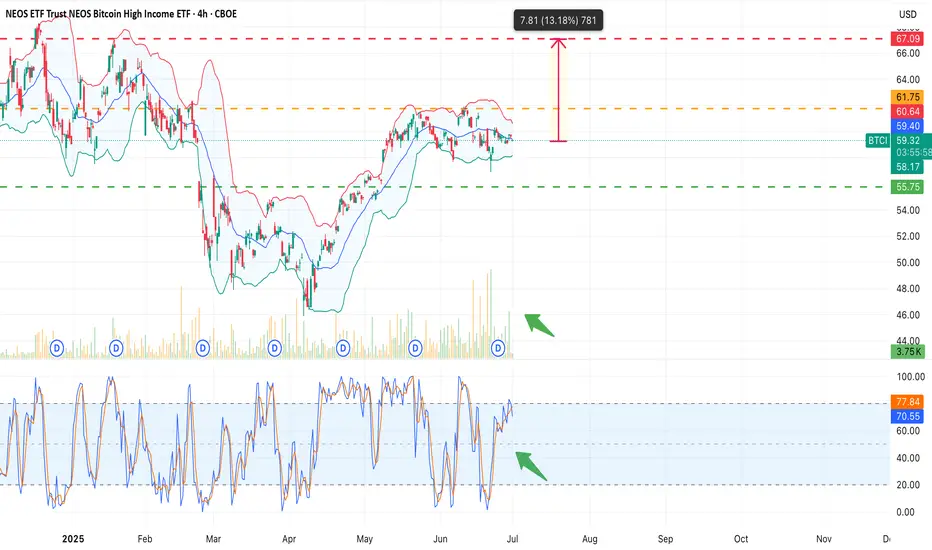
CBOE:BTCI Current price: $59.64
Strong volume is building up (green arrow), and the stochastic oscillator shows bullish momentum returning.
Price is consolidating just under the resistance at $60.90–61.75, with a potential upside of +13.2%, targeting the $67.09 zone.
📈 If volume holds and breaks above $61.75, the move toward the target becomes likely.
🟩 Key support: $58.07 / $55.75