MSTU It's not for youI bought the Monday after the first full week MSTU came on the market. I knew about it ahead of time, and I was tracking it. I bought pre-split. Now, the OBV is looking up again, and we could be in for round 2.
Key stats
About ETF Opportunities Trust T-Rex 2X Long MSTR Daily Target ETF
Home page
Inception date
Sep 18, 2024
Structure
Open-Ended Fund
Replication method
Synthetic
Dividend treatment
Distributes
Distribution tax treatment
Ordinary income
Income tax type
Capital Gains
Max ST capital gains rate
39.60%
Max LT capital gains rate
20.00%
Primary advisor
Tuttle Capital Management LLC
Distributor
Foreside Fund Services LLC
MSTU is designed for making bullish bets on the stock price of MicroStrategy Incorporated through swap agreements. The objective is to obtain daily leveraged exposure equivalent to 200% of the fund's net assets. To maintain this exposure, daily rebalancing is performed to make adjustments in response to MSTRs daily price movements. As a geared product, the fund is intended as a short-term tactical tool, rather than as a long-term investment vehicle. As a result, returns may deviate from the expected 2x if held for longer than a single day due to compounding. This strategy is high-risk and does not include a defensive position as part of its overall process. Note that, should MSTRs value decline by more than 50% relative to the fund, investors could face a total loss. Additionally, the fund could potentially lose money over time, even if MSTRs performance strengthens. The fund is expected to invest in money market funds, deposit accounts, and short-term debts.
Related funds
Classification
What's in the fund
Exposure type
Technology Services
Cash
Stock breakdown by region
Top 10 holdings
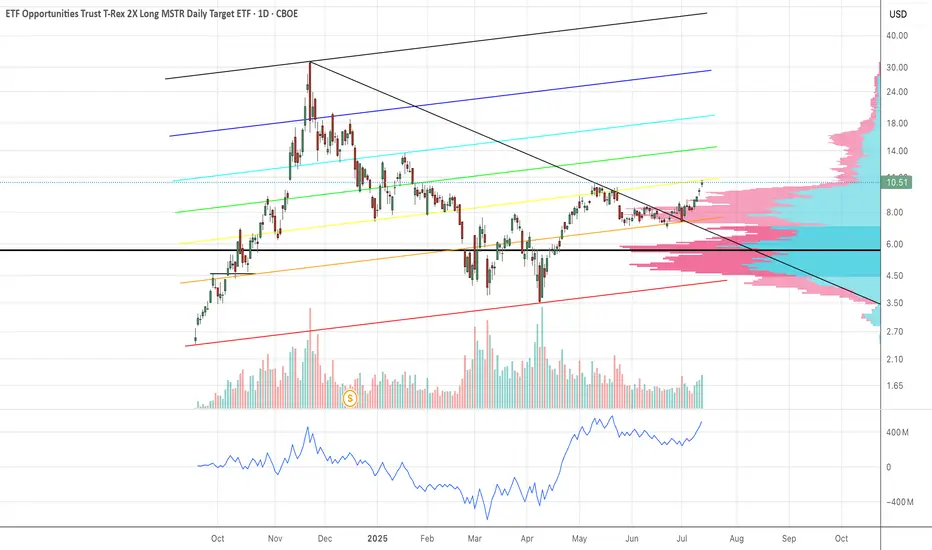
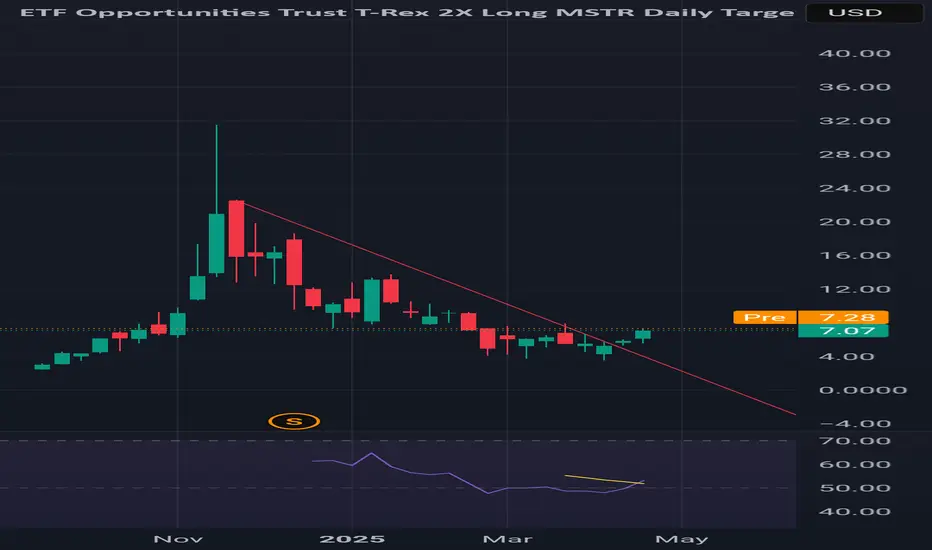
Chart Pattern Analysis Of MSTU.
From K1 to K6,
It is a small scale consolidation or a bullish triangle pattern.
The supply pressure is decreasing too.
It seems that K7 or K8 will break up or fall down.
If the following candles close upon the neckline,
It is likely that another bull run will start here to test 14USD area.
On the

MSTUThat's a $ retrace of the overhead slash .236 fib. Set the little bird free. You are free little bird. Fly away!
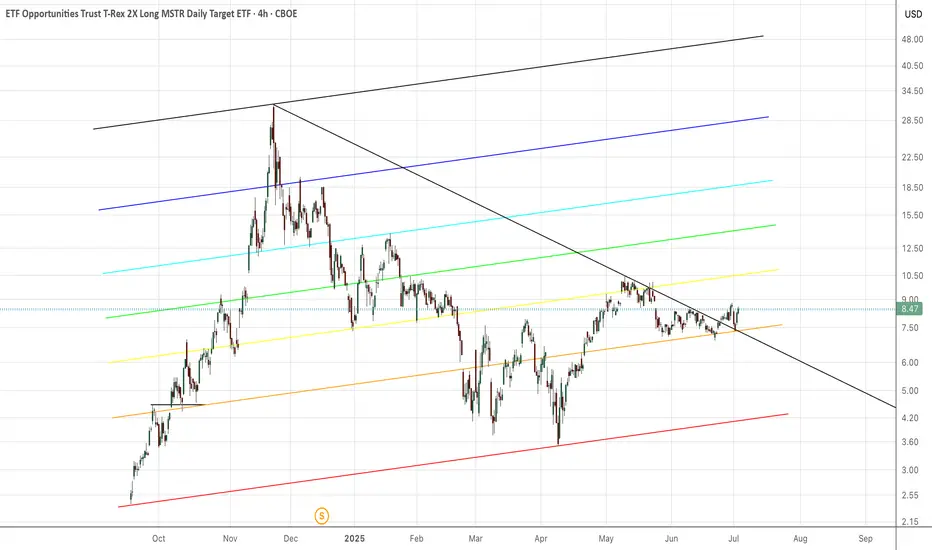
$MSTU – Breakout Brewing or Bull Trap? Here’s My TakeSwing Setup | Risk/Reward 3:1 | Watching MACD & Ichimoku
📊 This is a leveraged ETF that tracks NASDAQ:MSTR , and it’s setting up for a potential breakout. Here’s the breakdown:
🔍 Chart Context:
Price: $8.11 (as of June 11, 2025)
Target: $11.40 area (+40.57%)
Stop: $7.07 (–12.82%)
R:R: 3.16 – att

MSTUMy original position, which I still have, was entered around $4.50, but well before the stock split. I bought some more after the peak, but before the dip after the dip. That's always the one that gets you. So that second position is a tad underwater, but hopefully not for long. If BTC can hol

MSTU - Microstrategy 2x Leverage TargetsI feel like BTC will hit ATH soon, very soon. Likewise this leveraged ETF will likely run as well. I have mapped out some upper targets for the bulls. Plenty of room to run on the daily time frame. Not financial advice. DYOR.

12.50 next week Keeping it simple, Long mstr also 400 next week this is going to explode pending bitcoins rise past 100k.
MSTU (T-REX 2× Long MSTR Daily)Chart targets
Support at the Ichimoku Kumo top (~ 7.40 – 7.50) on 1 H & daily – this is your “buy zone.”
Initial upside to 8.10–8.30 — where yesterday’s 5 min candles peaked and the daily cloud resistance sits.
Secondary target ~ 9.00 — prior swing high from last December.
CSP entries (May 16)

Nice value gap....MSTUI want everyone to benefit on this! BTC has shown resilience in a horrible market and it's picking up. We can see the double bottom and nice formation on the upside. My humble opinion is that people are moving their crappy stocks and moving it to BTC in the hope that it goes back to 88k like it did

MSTU to fly soon....you need to see the signsLet's take a step back. Higher lows!!! and BTC is hitting a double bottoms during a terrible week in stock. That should be telling that while we are making a turn (with volatility), there is a very fav upside case here. I'm not emotional about any of this, just follow the signs and the data! Next we

See all ideas
Summarizing what the indicators are suggesting.
Oscillators
Neutral
SellBuy
Strong sellStrong buy
Strong sellSellNeutralBuyStrong buy
Oscillators
Neutral
SellBuy
Strong sellStrong buy
Strong sellSellNeutralBuyStrong buy
Summary
Neutral
SellBuy
Strong sellStrong buy
Strong sellSellNeutralBuyStrong buy
Summary
Neutral
SellBuy
Strong sellStrong buy
Strong sellSellNeutralBuyStrong buy
Summary
Neutral
SellBuy
Strong sellStrong buy
Strong sellSellNeutralBuyStrong buy
Moving Averages
Neutral
SellBuy
Strong sellStrong buy
Strong sellSellNeutralBuyStrong buy
Moving Averages
Neutral
SellBuy
Strong sellStrong buy
Strong sellSellNeutralBuyStrong buy
Displays a symbol's price movements over previous years to identify recurring trends.
Frequently Asked Questions
An exchange-traded fund (ETF) is a collection of assets (stocks, bonds, commodities, etc.) that track an underlying index and can be bought on an exchange like individual stocks.
MSTU trades at 6.70 USD today, its price has fallen −17.79% in the past 24 hours. Track more dynamics on MSTU price chart.
MSTU net asset value is 6.69 today — it's fallen 8.98% over the past month. NAV represents the total value of the fund's assets less liabilities and serves as a gauge of the fund's performance.
MSTU assets under management is 1.35 B USD. AUM is an important metric as it reflects the fund's size and can serve as a gauge of how successful the fund is in attracting investors, which, in its turn, can influence decision-making.
MSTU price has fallen by −13.66% over the last month, and its yearly performance shows a 169.29% increase. See more dynamics on MSTU price chart.
NAV returns, another gauge of an ETF dynamics, have risen by −8.98% over the last month, have fallen by −8.98% over the last month, showed a −24.75% decrease in three-month performance and has decreased by −11.51% in a year.
NAV returns, another gauge of an ETF dynamics, have risen by −8.98% over the last month, have fallen by −8.98% over the last month, showed a −24.75% decrease in three-month performance and has decreased by −11.51% in a year.
MSTU fund flows account for 1.02 B USD (1 year). Many traders use this metric to get insight into investors' sentiment and evaluate whether it's time to buy or sell the fund.
Since ETFs work like an individual stock, they can be bought and sold on exchanges (e.g. NASDAQ, NYSE, EURONEXT). As it happens with stocks, you need to select a brokerage to access trading. Explore our list of available brokers to find the one to help execute your strategies. Don't forget to do your research before getting to trading. Explore ETFs metrics in our ETF screener to find a reliable opportunity.
MSTU invests in stocks. See more details in our Analysis section.
MSTU expense ratio is 1.05%. It's an important metric for helping traders understand the fund's operating costs relative to assets and how expensive it would be to hold the fund.
Yes, MSTU is a leveraged ETF, meaning it uses borrowings or financial derivatives to magnify the performance of the underlying assets or index it follows.
In some ways, ETFs are safe investments, but in a broader sense, they're not safer than any other asset, so it's crucial to analyze a fund before investing. But if your research gives a vague answer, you can always refer to technical analysis.
Today, MSTU technical analysis shows the strong sell rating and its 1-week rating is sell. Since market conditions are prone to changes, it's worth looking a bit further into the future — according to the 1-month rating MSTU shows the strong sell signal. See more of MSTU technicals for a more comprehensive analysis.
Today, MSTU technical analysis shows the strong sell rating and its 1-week rating is sell. Since market conditions are prone to changes, it's worth looking a bit further into the future — according to the 1-month rating MSTU shows the strong sell signal. See more of MSTU technicals for a more comprehensive analysis.
No, MSTU doesn't pay dividends to its holders.
MSTU trades at a premium (0.15%).
Premium/discount to NAV expresses the difference between the ETF’s price and its NAV value. A positive percentage indicates a premium, meaning the ETF trades at a higher price than the calculated NAV. Conversely, a negative percentage indicates a discount, suggesting the ETF trades at a lower price than NAV.
Premium/discount to NAV expresses the difference between the ETF’s price and its NAV value. A positive percentage indicates a premium, meaning the ETF trades at a higher price than the calculated NAV. Conversely, a negative percentage indicates a discount, suggesting the ETF trades at a lower price than NAV.
MSTU shares are issued by Tuttle Capital Management LLC
MSTU follows the MicroStrategy Inc - Benchmark Price Return. ETFs usually track some benchmark seeking to replicate its performance and guide asset selection and objectives.
The fund started trading on Sep 18, 2024.
The fund's management style is passive, meaning it's aiming to replicate the performance of the underlying index by holding assets in the same proportions as the index. The goal is to match the index's returns.