SET trade ideas
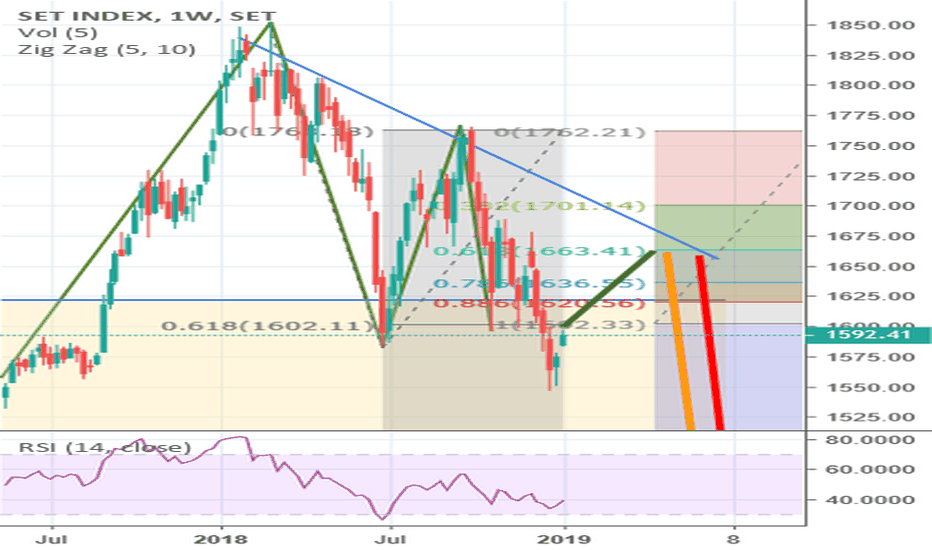
SET Index to hit 2-year new low (Weekly Chart)After SET index breakout 5 years channel at 1600.00, it retested to 1600.00 support line and showed the weakness breakout as long red and short green candles.
It dipped a little new low at 1590.00 so this notices the bearish sign of lower high and lower low.
Forecast : Bounce to 16500.00 and plummet to 1500.00/1350.00
SET TFDAY, rebound briefly before fall again.
Hammer pattern in Tfday on the exact support level(and also EMA200) hints that it will probably be a short-term bottom and bounce back to resistance level at 1692 and test 1700. (which is a tough one since it's a resistance level with a round number)
But the island reversal told us that there's a potential change coming on a way.
So SET might bounce back to retest a resistance level as a courtesy of the hammer and then decline again as a favor of Island top.
[SET INDEX TH] possible drops more in coming weeksWe can see LH and LL printing on the weekly chart.
There is also a lot of uncertainty about the election result.
Possible drop to the previous support zone (~1550)
If this zone breaks, very likely to send us to ~1500 and bounce there.
Going back above 1680 will invalidate this.
Good luck trading!
Stay safe!


