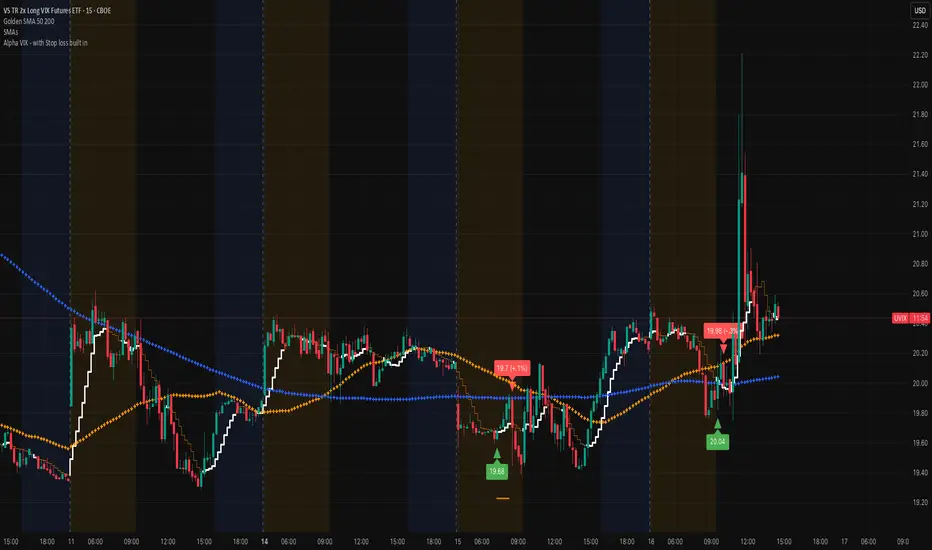
interesting set-up UVIXNew alert of UVIX....recent spikes yesterday, area of consolidation and nicely set-up.
We'll see, but seems very compelling!
Key stats
About VS TR 2x Long VIX Futures ETF
Home page
Inception date
Mar 28, 2022
Structure
Commodities Pool
Replication method
Synthetic
Distribution tax treatment
No distributions
Income tax type
60/40
Max ST capital gains rate
27.84%
Max LT capital gains rate
27.84%
Primary advisor
Volatility Shares LLC
Distributor
Foreside Fund Services LLC
UVIX offers daily 2x leveraged exposure to short-term VIX futures, designed to capture the implied volatility of the S&P 500, in a commodity pool wrapper. As a geared product, UVIX is designed as a short-term trading tool and not a long-term investment vehicle. Returns over holding periods greater than one day can be, and often are, significantly different from 2x. Like its peer products, UVIX does not deliver leveraged returns on the VIX index itself, but on front- and second-month futures contracts that are rolled daily. Structured as a commodity pool, investors will get K-1 at tax time but avoid the counterparty risk of an exchange-traded note.
Related funds
Classification
What's in the fund
Exposure type
Cash
Mutual fund
Bonds, Cash & Other100.00%
Cash81.30%
Mutual fund18.70%
Top 10 holdings

UVIX marching on (VIX proxy)Very nice spike this morning, that's typically a sign that there's more volatility in the works. Remember that we are at record lows on the VIX and that doesn't stay in this region for a long time. Add the Alpha VIX indicator to help you get an entry. The economy is brittle and staying focused on th
Consolidation taking place...VIX primed to spike soonBeen following the VIX for a while now, and it seems like the party will end pretty soon. Japan's yield is exploding and no one is talking about it (i.e., implications to US) and CNBC is celebrating small wins completely avoiding talking about bank's unrealized losses at historic levels and what imp
UVIX entry signal looks strongVIX is spiking bc of the market weakness. Looks like a good time to get in!
Always do your own due diligence and best of luck!

UVIX nice little chunk today!I picked up almost 3% today, and called it out as it happened! Always have Williams % and SMA9 on the 15min charts. When it crosses down or comes down (in the case of W%), just take your profit!
There will be another bounce real soon!

UVIX....great time to get in!I promised I would....check out UVIX. Nice set-up. Profit takers will do their thing, and VIX will spike up very soon, bringing UVIX along with it.
Best of luck and always do your own DD!

UVIX is your BEST insurance policy against the market!I've said this many times before, UVIX is an absolute gem if you know how to trade it. It's one of the only ETFs that has a mean reversal. The market is over heated and there's really nothing behind it except hot air, no major fundamentals. The economy is cooling, and you should be ready. Learn how

Great time to get into UVIXHorrible jobs numbers = "sh&t economy." Further validation that the last few days that S&P spiked were full of hot air. The economy is not doing well, and these are just lagging indicators, which means that actual problem is bigger. Default rates are higher than 2008, weakening dollar (9% since star

UVIX looking real sweet! VIX has a very unique quality, which is that it bottoms-out! The VIX is in a very nice place right now. Already did 3 trades over the last week ranging from 4 to +10%. I can't think of a better ETF to trade in times of uncertainty and risk. I'll be providing alerts for those who are interested in up

This is a GIFT....UVIXWe've had insane VIX spikes over the last few months and now things have calmed down a bit, but not for long. The one thing you can always count on is that VIX will spike again! This means UVIX will spike too. If you haven't already, add this to your list asap.
It's worth waiting. I made 15% the o

See all ideas
Summarizing what the indicators are suggesting.
Oscillators
Neutral
SellBuy
Strong sellStrong buy
Strong sellSellNeutralBuyStrong buy
Oscillators
Neutral
SellBuy
Strong sellStrong buy
Strong sellSellNeutralBuyStrong buy
Summary
Neutral
SellBuy
Strong sellStrong buy
Strong sellSellNeutralBuyStrong buy
Summary
Neutral
SellBuy
Strong sellStrong buy
Strong sellSellNeutralBuyStrong buy
Summary
Neutral
SellBuy
Strong sellStrong buy
Strong sellSellNeutralBuyStrong buy
Moving Averages
Neutral
SellBuy
Strong sellStrong buy
Strong sellSellNeutralBuyStrong buy
Moving Averages
Neutral
SellBuy
Strong sellStrong buy
Strong sellSellNeutralBuyStrong buy
Displays a symbol's price movements over previous years to identify recurring trends.
Frequently Asked Questions
An exchange-traded fund (ETF) is a collection of assets (stocks, bonds, commodities, etc.) that track an underlying index and can be bought on an exchange like individual stocks.
UVIX trades at 16.63 USD today, its price has fallen −5.31% in the past 24 hours. Track more dynamics on UVIX price chart.
UVIX net asset value is 17.25 today — it's fallen 22.71% over the past month. NAV represents the total value of the fund's assets less liabilities and serves as a gauge of the fund's performance.
UVIX assets under management is 610.65 M USD. AUM is an important metric as it reflects the fund's size and can serve as a gauge of how successful the fund is in attracting investors, which, in its turn, can influence decision-making.
UVIX price has fallen by −28.77% over the last month, and its yearly performance shows a −72.10% decrease. See more dynamics on UVIX price chart.
NAV returns, another gauge of an ETF dynamics, have fallen by −22.71% over the last month, showed a −61.47% decrease in three-month performance and has decreased by −70.90% in a year.
NAV returns, another gauge of an ETF dynamics, have fallen by −22.71% over the last month, showed a −61.47% decrease in three-month performance and has decreased by −70.90% in a year.
UVIX fund flows account for 720.70 M USD (1 year). Many traders use this metric to get insight into investors' sentiment and evaluate whether it's time to buy or sell the fund.
Since ETFs work like an individual stock, they can be bought and sold on exchanges (e.g. NASDAQ, NYSE, EURONEXT). As it happens with stocks, you need to select a brokerage to access trading. Explore our list of available brokers to find the one to help execute your strategies. Don't forget to do your research before getting to trading. Explore ETFs metrics in our ETF screener to find a reliable opportunity.
UVIX invests in cash. See more details in our Analysis section.
UVIX expense ratio is 2.19%. It's an important metric for helping traders understand the fund's operating costs relative to assets and how expensive it would be to hold the fund.
Yes, UVIX is a leveraged ETF, meaning it uses borrowings or financial derivatives to magnify the performance of the underlying assets or index it follows.
In some ways, ETFs are safe investments, but in a broader sense, they're not safer than any other asset, so it's crucial to analyze a fund before investing. But if your research gives a vague answer, you can always refer to technical analysis.
Today, UVIX technical analysis shows the sell rating and its 1-week rating is sell. Since market conditions are prone to changes, it's worth looking a bit further into the future — according to the 1-month rating UVIX shows the sell signal. See more of UVIX technicals for a more comprehensive analysis.
Today, UVIX technical analysis shows the sell rating and its 1-week rating is sell. Since market conditions are prone to changes, it's worth looking a bit further into the future — according to the 1-month rating UVIX shows the sell signal. See more of UVIX technicals for a more comprehensive analysis.
No, UVIX doesn't pay dividends to its holders.
UVIX trades at a premium (0.62%).
Premium/discount to NAV expresses the difference between the ETF’s price and its NAV value. A positive percentage indicates a premium, meaning the ETF trades at a higher price than the calculated NAV. Conversely, a negative percentage indicates a discount, suggesting the ETF trades at a lower price than NAV.
Premium/discount to NAV expresses the difference between the ETF’s price and its NAV value. A positive percentage indicates a premium, meaning the ETF trades at a higher price than the calculated NAV. Conversely, a negative percentage indicates a discount, suggesting the ETF trades at a lower price than NAV.
UVIX shares are issued by Corpus Partners LLC
UVIX follows the Long VIX Futures Index - Benchmark TR Gross. ETFs usually track some benchmark seeking to replicate its performance and guide asset selection and objectives.
The fund started trading on Mar 28, 2022.
The fund's management style is passive, meaning it's aiming to replicate the performance of the underlying index by holding assets in the same proportions as the index. The goal is to match the index's returns.