2008 Fractal But Not What You Think! @MelvinsMoves #spx #btc. This is a combo of two prior post I have made of the vix and spy fractal ... If this plays out then Idk .. its bearish
Pull down the indicators!!!! To See THE CHART
VIX trade ideas

VIX Daily 01/23/2023In this chart of the VIX daily I have changed the final pattern to a Bullish Flagish pattern. I anticipate the VIX to rise also due to macro conditions, and Data Flow, and of course Earnings. Earnings I am back and forth on since Bank reporting..... Thats going to be a big tell IMO.
This pattern morphed since last week when I was calling it a more of a bullish triangle which I pointed out didn't make a lot of sense to me, as the FOMC is doing their darndest to hold back the market, and wqith all the PCE and other data dump this week I expected a rising VIX, not falling.


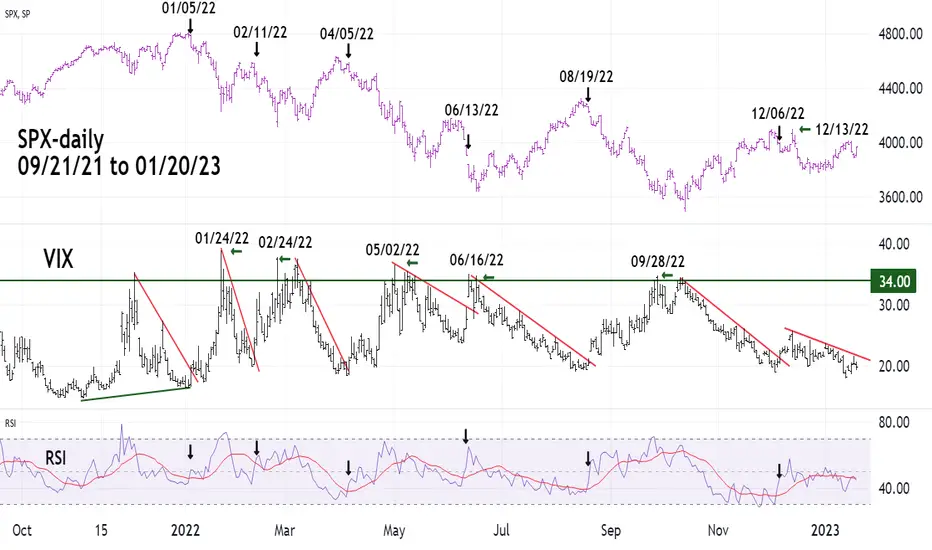
VIX and RSI - Top IndicatorMeasuring VIX with RSI gives effective signals for primary and intermediate S&P 500 (SPX) tops.
There are two factors to generate an SPX top signal.
1) Daily VIX breaking above its declining trendline.
2) Daily VIX – RSI breaking above its moving average line.
There’s a third factor in discovering primary SPX tops. Primary SPX tops usually occur with the daily SPX at a higher high and the daily VIX at a higher low. The most recent SPX primary top happened in January 2022. Note the VIX bottom in January was higher than the November 2021 bottom.
This phenomenon occurred at the SPX primary tops in 02/19/20, 09/21/18, and 01/26/18.
The factors to confirm a primary top are the same for intermediate degree tops.
There have been six top confirmation signals since January 2022.
They are as follows.
01/05/22
02/11/22
04/05/22
06/13/22
08/19/22
12/06/22
At the opening of the next trading day after a top signal is when to initiate SPX short trades.
The trade would be held until either the VIX exceeded 34.00 or the SPX is at a higher level than the short entry.
The VIX level to exit the short could be adjusted depending on recent VIX action, you want to find a general level in which VIX advances terminated.
The covering of SPX short trades would occur on the opening of the next trading day after VIX exceeded 34.00 or when the short trade is at a loss.
The six short exit signals with gain/loss are as follows.
01/24/22 gain 8%
02/24/22 gain 5%
05/02/22 gain 9%
06/16/22 gain 1%
09/28/22 gain 13%
12/13/22 loss -2%
Note the top signal on 06/13/22 came after a significant decline. The entry point on the next trading day was after a gap down. These two factors were warnings that the trade may not have been effective.
The trade after the 12/06/22 signal quickly became a loss.
Of the six signals since January 2022 – two were ineffective, a success ratio of 4/6 or 66%.
VIX Roadmap Oct 2022This whole pattern since late Jan looks like triangle consolidation and appears to be in Wave E before. If correct, Vix blow off coming

$VIX @ lower end of range, hard to call if it'll break$VIX is @ lower part of range
Daily :
Broke short trend, dotted line
Has positive divergence
-
Weekly:
Close to lower part of Symmetrical Triangle (will move fast in direction it breaks) White Lines, 2nd chart
TOO EARLY to call but #VIX teetering
#stocks $SPX #SPX #SPY $SPY

VIX VIX is viewed on stocks. so basically a support and resistance moves only.
Trade base on your decissions.
If you like my Ideas comment or suggest.
We keep growing, We learn everyday. IF you like it come and check me out.

Watch out for the VIXSince 2018, there is a support line on the VIX, and everytime those levels are visited, it goes up.
If it does, we are going to see uncertainity and prices go down, probably.
If it goes breaks the support line, there are high chances of a bullmarket.


VixComing up against that 50 sma AGAIN.. can't seem to break over it and every time it rejects the market takes a leg up ..
..also you can see trendline support is now Resistance
.1 hour CCI is telling me we pullback here so unless this is a black swan I'd be very careful opening up any shorts today
1 hour RSI also getting extended
For that reason I think this will pullback here

Looking at the #vix in the 12h with bullish divergence Looking at the #vix in the 12h with bullish divergence and Lower Lows printed as it moves to the upside. #vix moves opposite from #crypto #BTC

Long VIX Mar $20 CallsToday was the first day in a while where bad news was bad for the market. After bouncing down off downward sloping trend resistance stocks moved lower on the day. Volatility has been relatively low and I'm looking to take advantage of that buy going long the Mar $20 calls. This should provide a good hedge against further market downside.

VIX💥1D -TIMEFRAME ANALYSISVIX💥1D -TIMEFRAME ANALYSIS
💗Hello ladies and gentlemen
This is my new idea for 💥VOLATILITY S&P 500 INDEX
I hope my idea is clear
Support me by like and share thank you
Stay Safe💯💲💲💲
Good luck💰😍

$VIX to 22.2Let's see if my algo levels work even for VIX. It bounced perfectly off the below support. Next up will be 22.20. LFG!

Will history repeat again?Look at the VIX chart here; we are again in the VIX 18th zone. In 2022 it was an excellent indicator to spot the bottom; it works during the bear markets only!
So if we are still in a bear market, it should bounce from the 18 level hard and Indexes to fall. If we are entering a bull market, this setup can fail right here.
I doubt it will fail until we see Q1 lows in markets. I might be wrong, and this setup can fail in a grand style.
The VIX bottoms have an excellent correlation with SPX highs (at the bottom orange colour); look for the yellow marked pointers for the 2022 patterns from VIX 18 level. I think we will repeat the same pattern again.

Volatility Enthusiasti would be so cool if i traded the vix. call up the boys and tell them to fill the bags up

Bull Trap Ahead!! Max pain incoming...In trading, a bull trap is a situation where a trader (beginner) buys an asset believing its price will continue to rise, only to see it fall sharply soon after. If you inspect the SPX chart by yourself, you'll see:
1- lack of increasing volume
2- absence of momentum
3- lack of definite/sufficient trend break
4- retesting of resistance level (Major downward trendline)
5- sus bullish candlesticks
6- last but not the least, the VIX is at the zone where the market always reverse to the downside. This is just a prime short entry in my opinion.
Overall, the macro market conditions still didn't improve that much. Ofc there is a chance it breaks up, however, the odds of this being a bull trap is wayyy more likely. Don't FOMO into anything and have a bi-directional outlook on the chart; inverting the chart might help. Protect your capital and lessen your position sizes until further confirmation. Take care

VIX - it broke to the downside!VIX has broken this long-time curve line - This is very bullish for stocks right now - I expect a retest - but it is likely for VIX to spike down in a very short of time and bounce as fast up.
The levels to watch are marked on the chart - observe SPX breakout aswell as it is ona resistance level for now.

VIX: VOLATILITY INCOMING??? / CHART UPDATE / SUPPLY & DEMANDDESCRIPTION: In the chart above I have provided an UPDATED MACRO chart for the VIX with more reliable SUPPLY & DEMAND POCKET PLACEMENT & UPDATED TRAJECTORY.
POINTS:
1. DEVIATION of 7 POINTS in PRICE ACTION places SUPPLY & DEMAND POCKETS where most STABLE CONSOLIDATION OCCURS.
2. Current trend shows a DESCENDING CHANNEL with VIX NEARLY DOWN 50%
3. MACD'S LOWEST POINTS decides PERIODS where VOLATILITY comes to an END.
4. UPCOMING PREDICTION OF POSSIBLE NEW LOW IS FORMULATED FROM AN AVERAGE OF PERIODS MARKED BETWEEN LOWEST POINTS OF MACD THEREFORE: 91 Days + 135 Days + 109 Days = ROUGHLY 112 Days.
5. RSI signals increased VOLATILITY AFTER BREAK of 40 on RSI.
*IMPORTANT: SUPPORT at 19 has OFFICIALLY BEEN BROKEN. LOSS of 19 CAN BE A STRONG INDICATOR FOR OVERALL MARKET RALLY IN THE POSITIVE.
SCENARIO ONLY ONE: IF YOU ARE A BEAR YOU WANT TO SEE A REGAIN OF 19 SUPPORT AND FURTHER PUSH DOWNWARD FOR BULLS.
TVC:VIX

Shopping stocks for my Old Lady- Dogs of the dow pre recession? When in doubt, choose positive carry.
Dividend paying companies that are lagging. Good and bad.
Good because they are priced with less optimism.
Bad because the price my correctly reelect to opportunity going going forward.
Either way, I like looking at dogs of the dow and dogs of the sp500 to do research.
Ive found many gems that way, even if I choose not to use the strategy.
We dont control outcomes. We only control our habits and decisions. The exercise effort is the gold.
Dividends pay me while I wait. Selling premium pays me while I wait. Earning interest pays me while I wait.
Ideas can take longer than you think to work. May as well get some cashflow and reduce your cost basis over time.
P.S. Dont tell my girlfriend I made a video mentioning her. kthankxbye

$VIX $SPX nearing 2018 trendline before seasonality bounceWith the recent $VIX crush markets are resetting sentiment and creating an excellent hedging / short opportunity in markets
Upcoming seasonality favors a $VIX bounce with middle of January typically marking a bottom before a year high in March from a seasonality perspective
charts.equityclock.com

If year 2000, 2008, and 2020 had a baby and named It Vix 180Complete collapse of all systems, Vix could hit 180 before 2030. Just a unpopular view. Currently backtesting trendline brake. Be careful traders!

✅VIX BREAKOUT|SHORT🔥
✅VIX is going down currently
And the pair broke the key structure level
Which is now a resistance, and has made a pullback
And the retest, so I think the price will go lower now
SHORT🔥
✅Like and subscribe to never miss a new idea!✅
