VX1! trade ideas

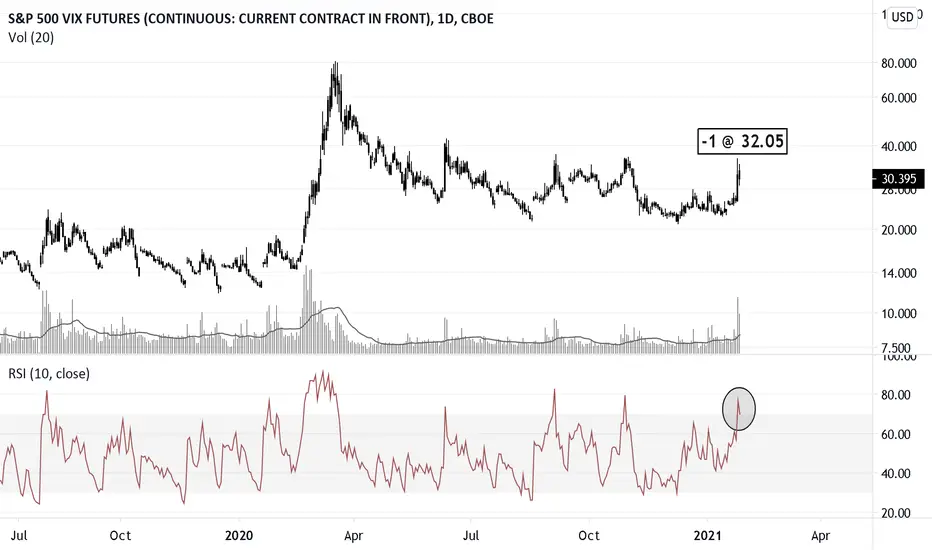
VixedThe volatility index otherwise known as the vix is overextended above 30 with the RSI well above it's upper bound.
I've opened a short at 32.05 on the March(H) contract.
Historically, the vix sells off soon after it breaches the upper RSI boundary. Unless a cataclysmic event occurs, I think history will repeat.
VIX Wedge OutlookThe VIX appears to have bottomed and is forming a wedge. It appears to have good RSI strength, with volume increasing. This has the looks like it will break out in late january, early february. This would have some interesting implications for the S&P500 as it tries to hold all time high valuations.

Seatbelt and Tray Tables in Upright Position VIX?Ready for blast off...let's see how high she can fly

Target 30ish for VIX Coming Up Very SoonTargeting just over 30 in VIX for upcoming week or two. Can't make any promises, but it would make sense with the time resistance and the trend line on top. That is, if charts can be trusted :)
We shall see how it all plays out.

VIX Really Forming A Definitive BaseVIX is now really forming a solid definiitive base. I was surprised to not see it climb as much yesterday due to the new events; however, I was reminded these types of reactions to such massive affairs sometimes take days or weeks to fully realize. Plus the institutional funds rolling in have prevented any type of predicted crashes…just delaying the inevitable.
At any rate, VIX is forming higher lows and climbing steady. We might peak today, then cool off once more, and finally, take it into overdrive in 2-4 weeks’ time.
Good luck trading all.

VIX Shall Return, and Return with FuryVIX is likely to peak out this week and retract next. After that, I would anticipate late January to early March to be some of the highest peaks it will see this year. It is not a coincidence this will come after about a year from the initial COVD crash.
Unsure of how high, but I would start getting in on it later next week before inauguration time and/or early February. No matter what, the market will not like uncertainty, whether it is about COVID or a new president, and we will see some true VIX fireworks IMO.
1-7-21 (Peak)
24.1

Just a Tasty Little Snack VIXBoy that was a nice small spike, VIX, thank you for the appetizer. Mostly likely cause seems to be a sell off due to tax gains being taken in 2021 (new tax year).
What's to come for the next course and when?
I would expect another more powerful spike in upcoming months, most likely end of February or March when interest rates begin to rise and COVID effects have begun to be tabulated and realized.

VIX About to Transform into Trending Upward?Appears as though VIX is about to start heading upward instead of down. We seem to be right at the threshold with the lows are getting higher and the highs soon to be getting higher as well. This makes perfect sense with the estimated timeline of financial crumble in February/March.


LONG VIX Jan20'21 Expecting bounce from extremely oversold weekly and daily levels. If stop breached, be prepared to catch new daily reversal on lower levels with a tight stop.

LONG Jan20 VIX FuturesExpecting bounce from extremely oversold weekly and daily levels. If stop breached, be prepared to catch new daily reversal on lower levels with a tight stop.


VIX Up We Stay Out
VIX FiFT is green MCDX+ Banker's Volume surge since 19 Oct.
Turtle Traders were advised to stay out when VIX FiFT is GREEN.
Continue to stay out as currently VIX ATOM Buy
36.5 is Resistance level. VIX is expected to continue hoovering around this level for next week waiting for major event to complete.
---- Major Even ----
Nov 2 ISM Manufacturing PMI
Nov 3 Presidential Election
Nov 4 ADP Non-Farm Employment Change
Nov 4 ISM Services PMI
Nov 5 Unemployment Claims
Nov 6 FOMC Statement
Nov 6 Federal Funds Rate
Nov 6 FOMC Press Conference
Nov 6 Average Hourly Earnings m/m
Nov 6 Non-Farm Employment Change
Nov 6 Unemployment Rate
--- S&P ---
All sectors are in -ve FIFT
BIOTECH SEL INDUSTRY, H/CARE EQUIP SEL IND, HOMEBUILDERS SEL IND, RETAIL SEL IND, SEC CYCLICAL/TRANS
, SEC/TECHNOLOGY triggered SLOW TURTLE SELL
--- Malaysia Sectors ---
All sectors triggered Slow Turtle Sell and show -ve FiFT except TRANSPORTATION & LOGISTICS
Technology Sector triggered Sell at Peak signal.

Global Insolvency CrisisPeak Volatility in the near term.
This is not about elections.
This is not about COVID.
We are in the midst of a Global Insolvency Crisis.
Bills are due...


VIX Continue to dropAs predicted, VIX hit resistance on 4th sep and it starting to drop on the following week.
We are seeing almost all indices hit support and bounce starting week of 8 sep where bargain hunting and buy on dip signal appears in most of the US stocks
VIX has making 7 consecutive lower lows which very likely it will bounce (Stock might take a hit for this bounce. So be careful, do not chase if you miss last week's bargain hunting)
[ US Indices and Sectors ]
Generally most indices are showing bullish rebounce from support. However the bullish reversal doesn't seems to be strong (No Fast Turtle Buy except Technology Sector (XLK) and Nasdaq. Nasdaq FiFT still -ve which indicating BEAR is relatively stronger.
Summary :- Last week we are seeing rebounce from strong sell-off. Considering Nasdaq FiFT still -ve, i worry this is just a technical rebounce (meaning BEAR is not done).
Hence, short term trader may apply hit and run strategy (take profit when Fast Turtle Sell appear)
NOTE :- 17 Sep, FOMC will make a statement and gives their economic projection which will give a major impact to the global financial market.
[ Bursa Market ]
Similar to US, most of the Bursa indices also bounce from support and forming reversal candles with Fast Turtle Buy.
FKLI bounce from 1500 with fast turtle buy and FiFT turned +ve. This is good news.
ACE Market also trigger SLOW turtle BUY but currently at resistance. Chances of breaking the resistance looks good judging from 3 solid Bullish candles.
Construction, Plantation, Technology, Healthcare and Industrial Products appear to be stronger sectors to focus on.
*** Watchlist from 15 Sep ***
Industrial Product
AEM
KPS
SKPRES
ANNJOO - Long consolidation. Volume spike. Wait for breakout.
RGTBHD - BoD
VS
DNONCE
DUFU - FiFT turned +ve
ESCERAM (Ace Market) - BoB above 1.485
Technology
AEMULUS (Ace Market) - BoD with VOLUME
FRONTKN - Fast Turtle BUY. FiFT still -ve.
INARI - BoD, pullback with low volume.
MI - BoD near EMA50 support (**Good Risk Reward Ratio)
PENTA - BoD. Slow Turtle Buy above 4.
UWC - FiFT turned green.
Plantation
BPLANT - Slow Turtle Buy with VOLUME
JTIASA - Wait for breakout about .75
Healthcare
LKL (ACE Market) - Need to break 1.3 to rally
HARTA - BoD but BEARISH. Hit and Run
KOSSAN - BoD but FiFT -ve and Bearish.
PHARMA - BoD
SUPERMX - BoD confirmed with gap up. Need to break 9.8 to continue the rally.
TOPGLOV - BoD confirmed with gap up. Need to stay above 8. Next Resistance is around 9.3 zone.
FINANCE
FINTEC (ACE Market) - BoD, FiFT +ve
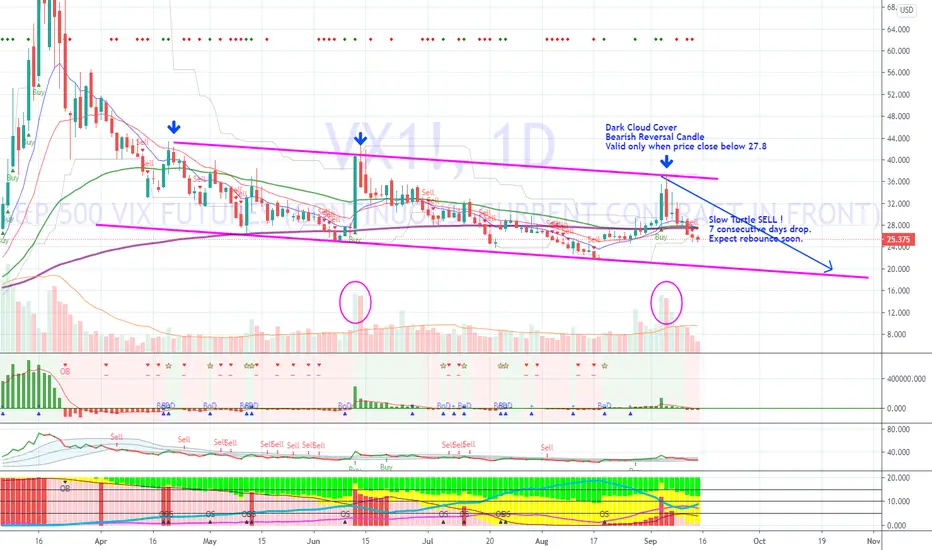
VIX - Dark Cloud Cover at Resistance, Hammer on Major indicesVIX is bullish since BoD signal on 19 Aug.
VIX is seems to hit resistance on 4 Sep and form Dark Cloud Cover Bearish Reversal Candle.
This Reversal is valid only if VIX drop and close below 27.8.
FiFT still +ve and ATOM still BUY.
However, there is a sign of Hidden Bearish Divergence.
Note: We want to see VIX to go down in order to have Stock to go up. VIX is normally use to gauge investor sentiment or fear. If VIX up, Fear is increase. Thus Stock down.
The chart showing that VIX is still bullish but potentially hit the resistance and ready to pullback based on Bearish candle pattern and Hidden Bearish Divergence formation.
FiFT is still +ve but the BULL force is significantly reduced. ATOM is still Buy.
No sell signal seen on VIX chart yet.
Major Indices:-
Mostly close with Hammer candle and supported by key EMA20 / EMA50 level.
SGX Stock Watchlist (4 Sep) - Filtering Criteria : Price > 0.10 Vol > 500K, Price > EMA50, EMA20 > EMA50, Turtle, FiFT, BoD and Volume Ratio
Frasers Cpt Tr :FiFT +ve signal with ATOM. Volume is 1.8 time higher than previous day volume.
SoilbuildBizReit : Slow Turtle Buy with ATOM. However, volume is lower then previous day. Price is 12% above EMA20. Might be too high to chase.
UG Healthcare – Buy on Dip candidate. Fast Turtle Buy with higher volume (1.3 time higher than previous day). Seems to be supported at EMA50 but FiFT and ATOM still SELL.
BURSA Stock Watchlist(4 Sep) - Filtering Criteria : Price > 0.30 Vol > 2mil, Price > EMA50, EMA20 > EMA50, Turtle, FiFT, BoD and Volume Ratio
BPlant - Slow Turtle BoB with volume, FiFT Spike and ATOM Buy
D&O - Cup and Handle breakout hittin first target at 1.1. Volume buildup, ATOM Buy and FiFT +ve
DANCO - Slow Turtle and Fast Turtle Buy, FiFT +ve signal, ATOM BUY. 0.615 target hit. Next is 0.675
THPlant - Breaks 0.38-0.40 with volume. Slow Turtle Buy, BoD spot on. FiFT +ve. ATOM Buy. Next target 0.47
APPASIA - Bounce from Fibo 0.386. Buy on DIP with star. FiFT +ve, ATOM price line GREEN. Fast Turtle Buy. Volume spike up..
MMAG - Hit first Rounding Bottom Target 0.565. FiFT +ve, ATOM Buy, Slow Turtle Buy. Wait for pullback.
NASDAQ Stock Watchlist(4 Sep) - Filtering Criteria : Price > 40 Vol > 2mil, Price > EMA50, EMA20 > EMA50, Turtle, FiFT, BoD and Volume Ratio
CAESARS Ent – FiFT Signal with ATOM. Breaks 47.32. Next Target 54.6
BROADCOM – FiFT signal with ATOM. Volume is 1.4x of yesterday volume. Price is 6% above EMA20 and 11% above EMA50. Good candidate if you can risk 12% (SL below EMA50)
Immunomedics – FiFT signal with relatively higher Volume. Price near key EMA with attractive Risk Reward Ratio

