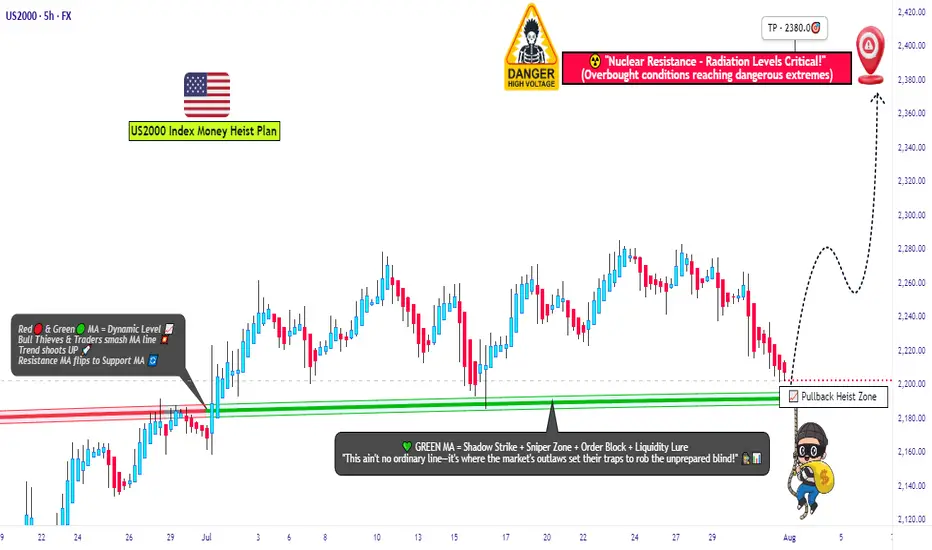
"US2000 THIEF TRADE: SWIPE & ESCAPE BEFORE BEARS!"🚨Russell 2000 Robbery: Pullback to Power Play⚡️💰
🌟Hi! Hola! Ola! Bonjour! Hallo! Marhaba!🌟
Dear Market Robbers & Money Makers, 🤑💰💸✈️
This is a full-blown heist plan on the US2000 (Russell 2000) index using the Thief Trading Style™, a perfect combo of real-time technicals + macro heat.
Get ready to
Related indices
RUT Echoes IWM – The Livermore Playbook?The Russell 2000 (RUT) is painting a structure that mirrors the IWM ETF – a widening accumulation channel, setting up for a potential breakout. The VolanX protocol flags this as a classic Livermore Speculative Chart pattern, where phases of quiet accumulation lead to an explosive markup.
Channel Su

U.S. Small Caps Break Out: Dash for Trash Gathers SteamSitting in an obvious uptrend with momentum indicators skewing increasingly bullish, it looks like the U.S. small cap 2000 contract wants to go higher. The dash for trash is on!
Having just cleared the July 10 high of 2278, it’s provided a decent setup to initiate fresh longs, allowing for a stop b

Russell2000 Key Trading LevelsKey Support and Resistance Levels
Resistance Level 1: 2194
Resistance Level 2: 2210
Resistance Level 3: 2227
Support Level 1: 2154
Support Level 2: 2135
Support Level 3: 2113
This communication is for informational purposes only and should not be viewed as any form of recommendation as to a p

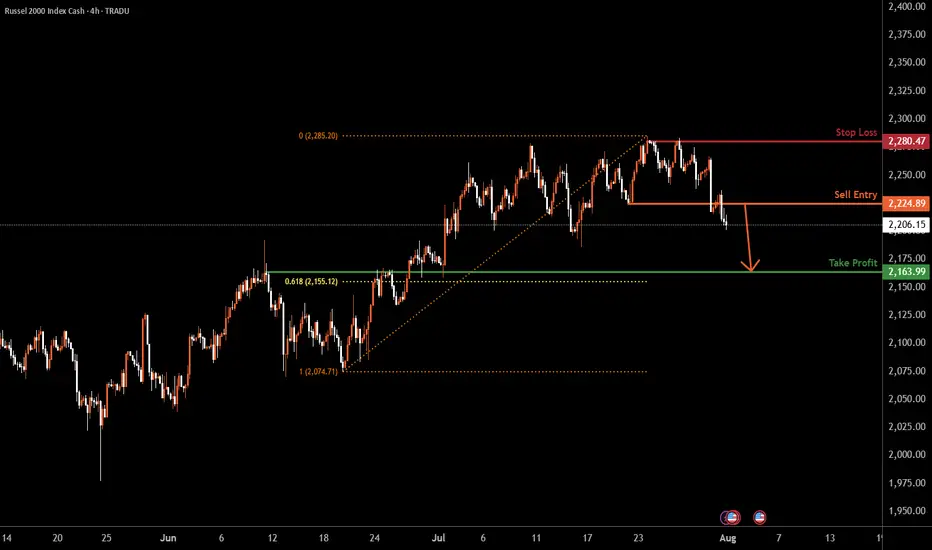
US2000 H4 | Bearish dropBased on the H4 chart analysis, we could see the price drop lower from the sell entry to the downside.
Sell entry is at 2,224.89, which is a pullback resistance.
Stop loss is at 2,280.47, a swing high resistance.
Take profit is at 2,163.99, which is an overlap support that is slightly above the 6
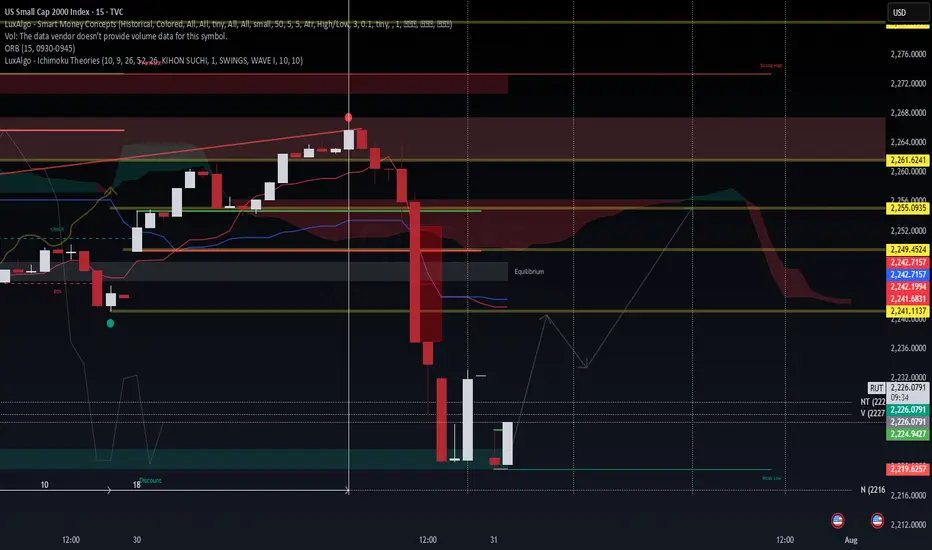
$RUT 15m – Liquidity Sweep + Discount Zone Reaction📉 TVC:RUT 15m – Liquidity Sweep + Discount Zone Reaction
WaverVanir DSS | July 31, 2025
The Russell 2000 just executed a sharp breakdown beneath equilibrium, tapping into our predefined discount zone and weak low near 2,219.62.
🧠 Smart Money Concepts Observed:
BOS (Break of Structure) confirmed
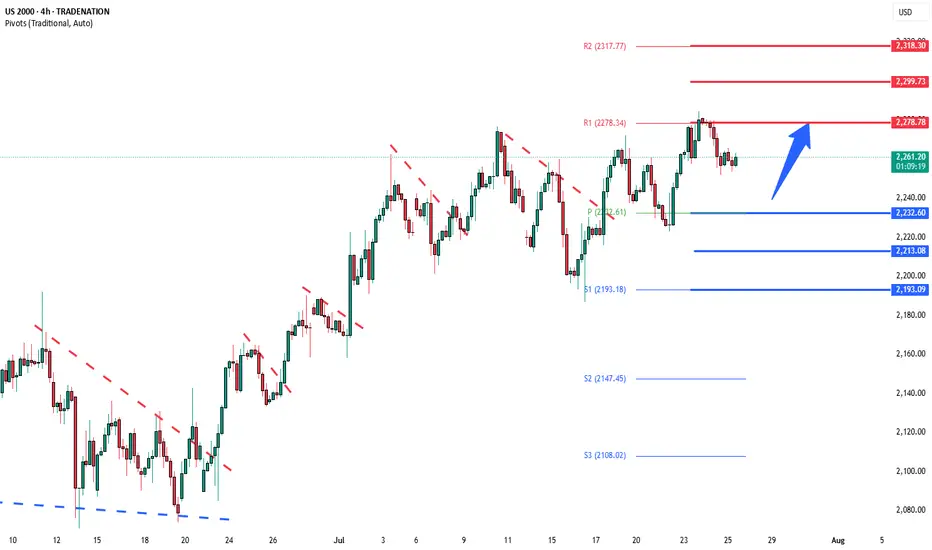
Russell2000 sideways consolidation supported at 2232Key Support and Resistance Levels
Resistance Level 1: 2278
Resistance Level 2: 2300
Resistance Level 3: 2318
Support Level 1: 2232
Support Level 2: 2213
Support Level 3: 2193
This communication is for informational purposes only and should not be viewed as any form of recommendation as to a p
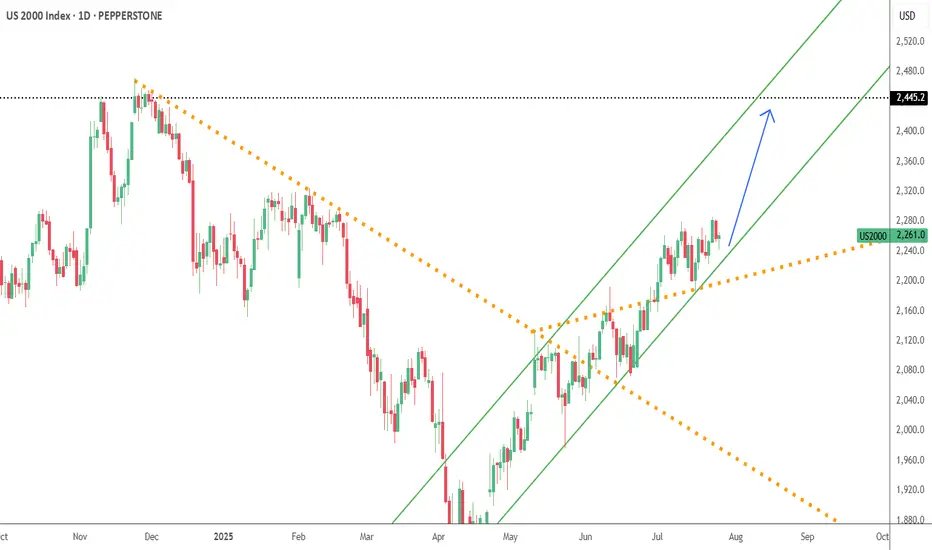
US2000--LONG--27_07_25-- Bullish trend continuation
--ascending channel
--Buy around 2249--2272
--TP around 2451
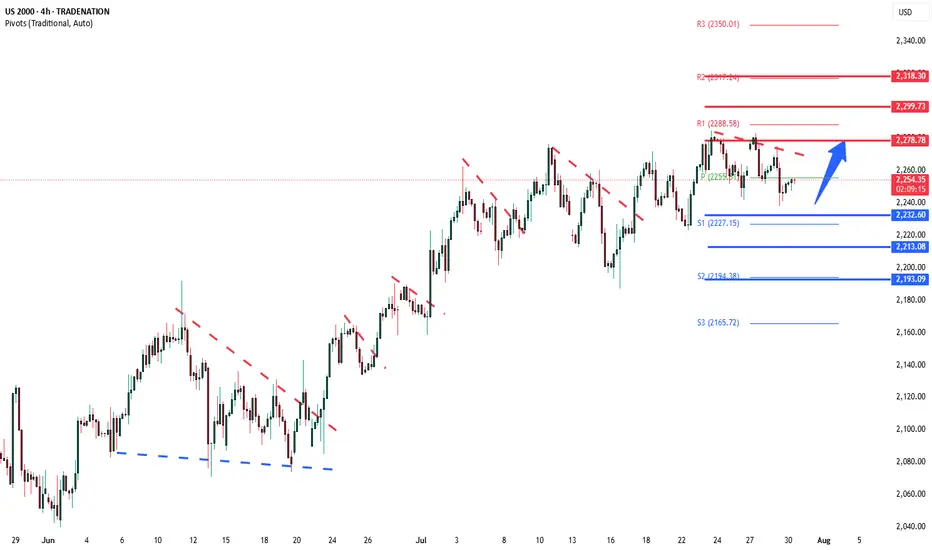
Russell2000 Bullish continuation supported at 2232.60Key Support and Resistance Levels
Resistance Level 1: 2278.80
Resistance Level 2: 2299.70
Resistance Level 3: 2318.30
Support Level 1: 2232.60
Support Level 2: 2213.00
Support Level 3: 2193.00
This communication is for informational purposes only and should not be viewed as any form of recomm
See all ideas
Summarizing what the indicators are suggesting.
Oscillators
Neutral
SellBuy
Strong sellStrong buy
Strong sellSellNeutralBuyStrong buy
Oscillators
Neutral
SellBuy
Strong sellStrong buy
Strong sellSellNeutralBuyStrong buy
Summary
Neutral
SellBuy
Strong sellStrong buy
Strong sellSellNeutralBuyStrong buy
Summary
Neutral
SellBuy
Strong sellStrong buy
Strong sellSellNeutralBuyStrong buy
Summary
Neutral
SellBuy
Strong sellStrong buy
Strong sellSellNeutralBuyStrong buy
Moving Averages
Neutral
SellBuy
Strong sellStrong buy
Strong sellSellNeutralBuyStrong buy
Moving Averages
Neutral
SellBuy
Strong sellStrong buy
Strong sellSellNeutralBuyStrong buy
Displays a symbol's price movements over previous years to identify recurring trends.
Frequently Asked Questions
The current value of Russell 2000 Index is 2,166.78 USD — it has fallen by −2.09% in the past 24 hours. Track the index more closely on the Russell 2000 Index chart.
Russell 2000 Index reached its highest quote on Nov 25, 2024 — 2,466.49 USD. See more data on the Russell 2000 Index chart.
The lowest ever quote of Russell 2000 Index is 106.07 USD. It was reached on Oct 28, 1987. See more data on the Russell 2000 Index chart.
Russell 2000 Index value has decreased by −4.07% in the past week, since last month it has shown a −1.56% decrease, and over the year it's decreased by −3.85%. Keep track of all changes on the Russell 2000 Index chart.
The top companies of Russell 2000 Index are NASDAQ:RKLB, NASDAQ:INSM, and NASDAQ:SMMT — they can boast market cap of 21.48 B USD, 20.65 B USD, and 20.10 B USD accordingly.
The highest-priced instruments on Russell 2000 Index are NYSE:GHC, NASDAQ:CVCO, and NYSE:GPI — they'll cost you 920.42 USD, 422.81 USD, and 410.20 USD accordingly.
The champion of Russell 2000 Index is NYSE:QBTS — it's gained 1.54 K% over the year.
The weakest component of Russell 2000 Index is NASDAQ:JBIO — it's lost −99.69% over the year.
Russell 2000 Index is just a number that lets you track performance of the instruments comprising the index, so you can't invest in it directly. But you can buy Russell 2000 Index futures or funds or invest in its components.
The Russell 2000 Index is comprised of 1892 instruments including NASDAQ:RKLB, NASDAQ:INSM, NASDAQ:SMMT and others. See the full list of Russell 2000 Index components to find more opportunities.