Rvx undecided still holding bearishMy guess is the market is waiting for a fed meeting to decide the direction for me Rty looks ready to die a horrible death but we will see.
I'm bearish bias right now until we see some goo price movement in either direction, maybe a lower high on price movement or break down lower on the RVX. sending rty to retestance
RVX trade ideas

Is Vol Overbought? Pt.3RVZ is looking more bearish. There is a ton of space to create a lower high here. Plus we have some overbought signals on both RSI and the stochastic. The MACD is looking like trending upwards, but even some sideways action can turn that trend bearish.
For now, I am leaning towards the VIX and the RVZ being bearish, and the VXN being bullish. Typically, you would like to see confirmation across all three volatility measurements to conclude that owning equities is safe. So be selective with your equity picks for now.

RVX (RTY's VIX) 9/6/2020RVX at the daily view.
This is a project that my trading team and I are conducting. This is 4 of 9 charts (available on Trading View) that searches for clues for an imminent correction by using both June and September 2020 cases. It's a comprehensive overview that connects the charts volatility, trends, divergences, credit, and currency strength.
In this chart, the RVX had RSI divergences prior to the corrections. In addition, the RVX created 3-4 higher lows in a row prior to a correction.

RVX (RTY's VIX) at a Decision Point 8/23/2020This is the RVX at the daily view.
The RVX has finally reached a decision point between the long-term wedge resistance and the supports below. Currently, the RTY is in a giant bull flag since August 3rd and doing a "correction over time."
A correction over time is actually a bearish in the very short-term, but bullish in the medium-term. Currently, the RTY is coiling up for another move up. The RVX indicates that more sideways to down movement is ahead for the RTY until the bull flag finally plays out. The RTY's bull flag is canceled out around 1460.
Currently, the bears flocked to both the NQ and the RTY. The market tends to hunt for shorts first and the the longs. Judging by how many bears have saturated the RTY, I'm expecting a small spike down first and then a rather big short covering rally.
Greed tends to punish both sides.

Stocks Remain in the Un-investable Chop BucketRussell Volatility remains highly elevated. That stocks have rallied so far sets us up for some excellent short-selling opportunities.
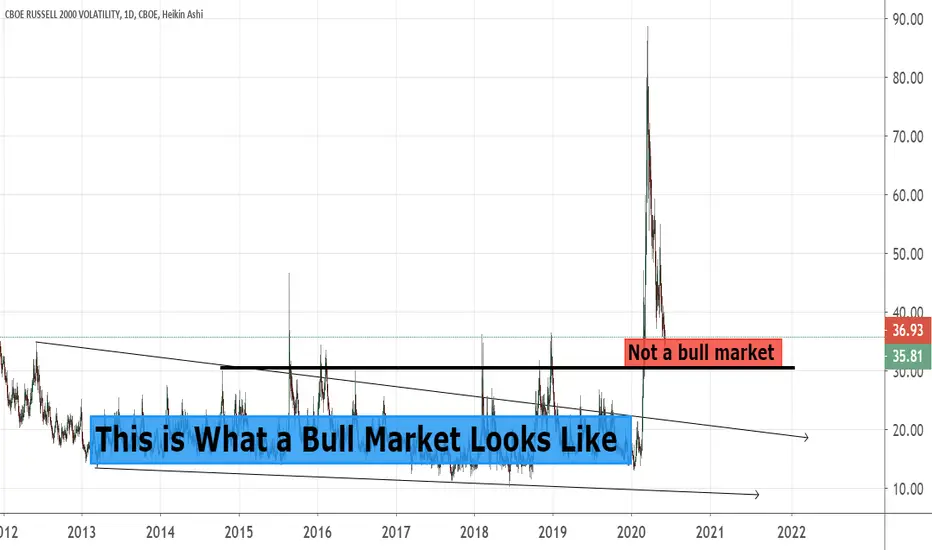
Russell Volatility rallied a MONSTER +32% in the same time frameThis is what buying with BOTH HANDS & FEET by the Big Volatility Players!

Bullish Breakout in Russell 2000 Volatility3rd Quarter Window Dressing is over as New Highs are fixed, time for volatility to rise BIG TIME and stocks to turn DOWN...

Comparison of Volatility Indices (Daily)This chart shows the most current values of Volatility Indices for the mostly used Future Underlyings: ES, B6, E6, ZL, ZN, ZC, ZW, Russell etc.
