10YR US Treasury Note Chart Fibonacci Analysis 052825Trading Idea
1) Find a FIBO slingshot
2) Check FIBO 61.80% level
3) Entry Point > 112/61.80%
Chart time frame:B
A) 15 min(1W-3M)
B) 1 hr(3M-6M)
C) 4 hr(6M-1year)
D) 1 day(1-3years)
Stock progress: A
A) Keep rising over 61.80% resistance
B) 61.80% resistance
C) 61.80% support
D) Hit the bottom
E
Related futures

US 10 yr Treasury Note Chart Fibonacci Analysis 051925Trading Idea
1) Find a FIBO slingshot
2) Check FIBO 61.80% level
3) Entry Point > 111/61.80%
Chart time frame:B
A) 15 min(1W-3M)
B) 1 hr(3M-6M)
C) 4 hr(6M-1year)
D) 1 day(1-3years)
Stock progress: B
A) Keep rising over 61.80% resistance
B) 61.80% resistance
C) 61.80% support
D) Hit the bottom
E

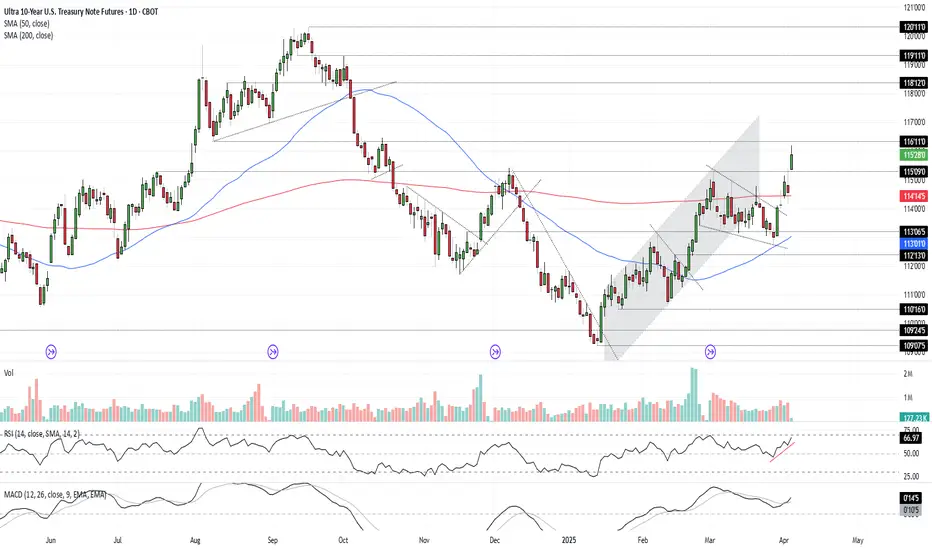
TN Fib FrameworkHigh Timeframe Fib Framework for the TN contracts which appear to be following a very simplistic Fibonnachi path

Bonds Don’t Lie: The Signal is ClearU.S. 10-year Treasuries are a crucial cog in the global financial machine, serving as a benchmark borrowing rate, a tool for asset valuation, and a gauge of the longer-term outlook for U.S. economic growth and inflation.
As such, I keep a close eye on 10-year note futures, as they can offer clues o
10 yr Treasury note Stock Chart Fibonacci Analysis 022825Today's chart analysis uses the Fibonacci fan line and extension.
Today, the 10-year treasury note touches the 114/423.60% of the 1st wave, and then U.S. stock markets rebound from falling in these days. Accordingly, QQQ has a nice 497/61.80% support level.
But if 10-year treasury note go over this

Treasury yields at a crossroads? The implications for marketsThe long end of the US Treasury curve has been influential for FX markets recently. The rolling 10-day correlation between US 10-year yields with the DXY, EUR/USD, GBP/USD, and USD/JPY is either strongly positive or negative. Even gold shows a notable -0.73 correlation, highlighting the influence of

TN! 10 Year Note Futures Bull ScalpLooking for a pullback into bear channel after the strong selling of 10-year bond futures from Friday's job report. Yields jumped today, so I would think there's some buyers coming into US session. At least there's a decent chance.

Buying Opportunity in T-Notes? After putting in a bottom in mid-October, T-notes have rallied sharply higher. Patient bulls have been afforded few opportunities to enter the contracts on a pullback, but that may soon change. Pullbacks are a healthy part of any sustained rally, as they allow market participants to take profits fr

10-Years Treasury Note: Weekly Head & Shoulders + Daily TriangleBearish continuation head and shoulders.
First entry on January 7, stopped on 13 January, second entry on February 4 on breakout confirmation of the daily triangle.
Risk / Reward 4.5
Potential target 135

10YR BondsMarkets bottom only through the 10 year bonds $TN forming a bottoming formation at 139, which roughly corresponds to 10YR interest rates topping at 2.2%. Might take a good week to churn out. Otherwise, adieu markets.

See all ideas
Summarizing what the indicators are suggesting.
Neutral
SellBuy
Strong sellStrong buy
Strong sellSellNeutralBuyStrong buy
Neutral
SellBuy
Strong sellStrong buy
Strong sellSellNeutralBuyStrong buy
Neutral
SellBuy
Strong sellStrong buy
Strong sellSellNeutralBuyStrong buy
A representation of what an asset is worth today and what the market thinks it will be worth in the future.
Displays a symbol's price movements over previous years to identify recurring trends.
Frequently Asked Questions
The current price of Ultra 10-Year U.S. Treasury Note Futures is 112'20'0 USD — it has fallen −0.19% in the past 24 hours. Watch Ultra 10-Year U.S. Treasury Note Futures price in more detail on the chart.
The volume of Ultra 10-Year U.S. Treasury Note Futures is 27.28 K. Track more important stats on the Ultra 10-Year U.S. Treasury Note Futures chart.
Open interest is the number of contracts held by traders in active positions — they're not closed or expired. For Ultra 10-Year U.S. Treasury Note Futures this number is 2.41 M. You can use it to track a prevailing market trend and adjust your own strategy: declining open interest for Ultra 10-Year U.S. Treasury Note Futures shows that traders are closing their positions, which means a weakening trend.
Buying or selling futures contracts depends on many factors: season, underlying commodity, your own trading strategy. So mostly it's up to you, but if you look for some certain calculations to take into account, you can study technical analysis for Ultra 10-Year U.S. Treasury Note Futures. Today its technical rating is sell, but remember that market conditions change all the time, so it's always crucial to do your own research. See more of Ultra 10-Year U.S. Treasury Note Futures technicals for a more comprehensive analysis.