Brick Wall Ahead? Bonds Grind Into Bearish Fade ZoneZB has rallied straight into a triple-confluence zone that screams fade risk. We’re stacked beneath a key trend line, sitting inside layered supply, and printing a textbook lower high. This isn’t a breakout, it’s a test.
Bearish Confluences in Play:
- Macro Downtrend Intact – Still printing LHs
Related futures

BEARISH ON BONDS Buyside has been taken, and we have formed a 12hr
bearish breaker. The liquidty for the weak is that sellside
sitting below the 50 percent level. Downside on Bonds could
make dxy rally this weak

How to Spot Head & Shoulders Patterns in TradingViewDiscover how to identify and validate Head & Shoulders patterns using TradingView's built-in pattern recognition tools in this detailed tutorial from Optimus Futures. Chart patterns are essential tools for many futures traders, and the Head & Shoulders formation is among the most recognized reversal

Bonds - Taking profitsBonds got a big boost out of the recent inflation number. A nice run but I'm taking profits here and taking a short position.

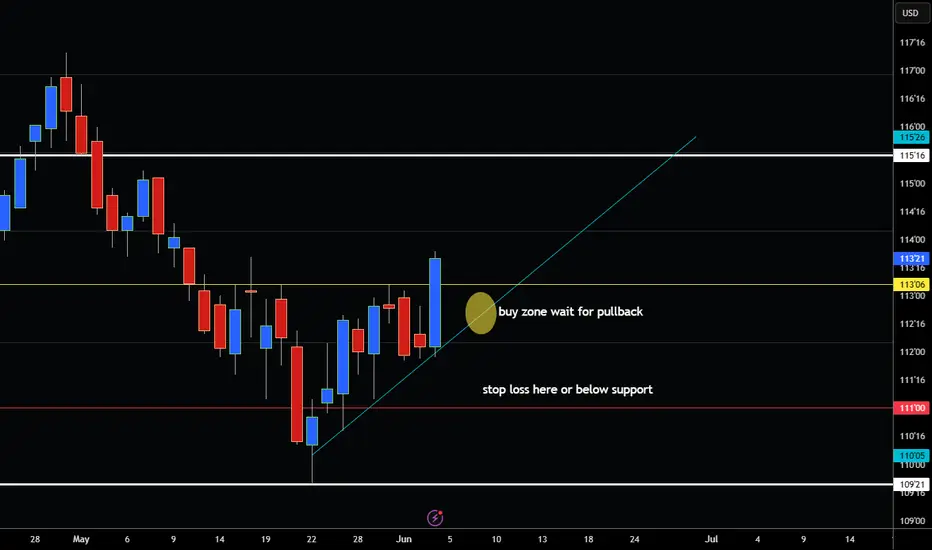
Did the Bond Market Just from a Bottom? Hey Traders so today was looking at the 10yr Treasury Bond and the 30 year and it looks like it just formed a 123 bottom formation on the charts. Add to that a 3 bar trendline and Bond Seasonality normally shows strength in the summer.
Now I am not a Bond Expert by any means and I could not tell
ZB Breakout Alert: Smart Money Pullback Above FVG!The 30-Year Bond Futures just broke key structure, and smart money seems to be eyeing a precise pullback above the Fair Value Gap
Here’s what I’m watching:
Clear market structure break
- Liquidity sweep before breakout
- Pullback aligning with ICT-style premium arrays
- Bullish continuation po

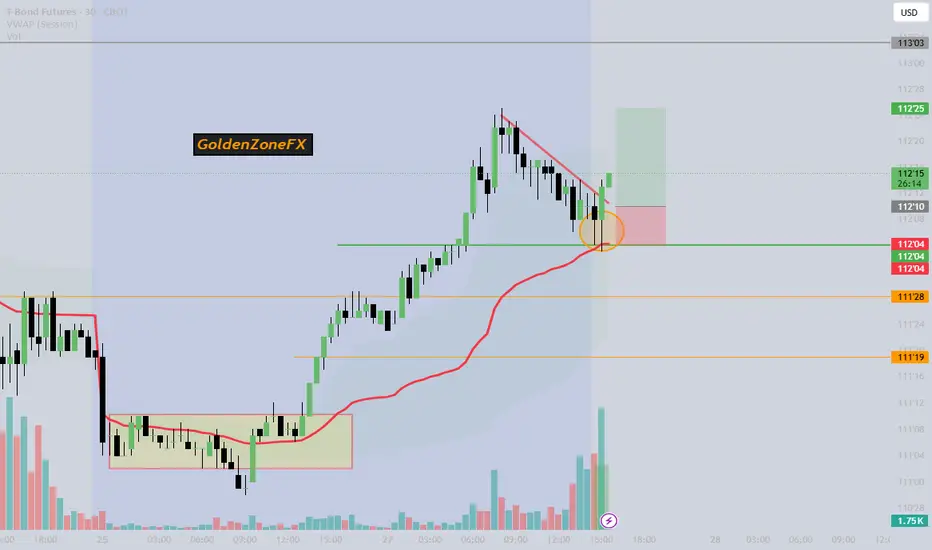
US. Notes Treasury Bonds BOS Steps In?There is a break of a bearish trendline, combined with volume confirmation and wick candles that give us strong bullish reversal pattern also combined with ICT and Price action confirmation that tell us where Smart money going.
Follow @GoldenZoneFX For more content and valuable Insights.

Bond holders soon will be RewardedThe bond market has just come through some of the worst times in history—crushed by inflation, aggressive rate hikes, and fiscal chaos.
But bondholders might soon be rewarded. In my view, the macro environment could deteriorate further, especially in the labor market.

$ZB - 30y Treasury Futures Sell off in Equity Risk OnThe 30-Year Treasury Bond Futures (ZB) sold off notably, driven by a combination of macro headlines and technical positioning. A key catalyst was the European Union’s decision to postpone the implementation of retaliatory auto tariffs until July 9th, which temporarily eased geopolitical tensions and

ZB1 Bullish trend Confirmation after a strong SignalThe price has successfully broken above previous resistance, confirming bullish strength. The breakout is supported by high volume, signaling institutional participation and strong momentum.
Key Technical Signals
Resistance Break: Price surpasses a critical level, flipping it into new support.
Vol
See all ideas
Summarizing what the indicators are suggesting.
Neutral
SellBuy
Strong sellStrong buy
Strong sellSellNeutralBuyStrong buy
Neutral
SellBuy
Strong sellStrong buy
Strong sellSellNeutralBuyStrong buy
Neutral
SellBuy
Strong sellStrong buy
Strong sellSellNeutralBuyStrong buy
A representation of what an asset is worth today and what the market thinks it will be worth in the future.
Displays a symbol's price movements over previous years to identify recurring trends.
Frequently Asked Questions
The current price of T-Bond Futures is 115'22 USD — it has risen 1.31% in the past 24 hours. Watch T-Bond Futures price in more detail on the chart.
The volume of T-Bond Futures is 558.76 K. Track more important stats on the T-Bond Futures chart.
Open interest is the number of contracts held by traders in active positions — they're not closed or expired. For T-Bond Futures this number is 1.74 M. You can use it to track a prevailing market trend and adjust your own strategy: declining open interest for T-Bond Futures shows that traders are closing their positions, which means a weakening trend.
Buying or selling futures contracts depends on many factors: season, underlying commodity, your own trading strategy. So mostly it's up to you, but if you look for some certain calculations to take into account, you can study technical analysis for T-Bond Futures. Today its technical rating is strong buy, but remember that market conditions change all the time, so it's always crucial to do your own research. See more of T-Bond Futures technicals for a more comprehensive analysis.