ZB - The Long Bond, will the reversal take place?Bonds are oversold on every trend level, monthly, weekly and daily. Whenever, indicators like RSI reached these levels, bonds reversed to the upside. Inverted yield curve suggests that FED is unlikely to become more hawkish then it already is. Look closely to 150 level, as a decisive break could signal a significant change in trend.
ZB1! trade ideas

The Big Bear Market in 30 Year BondsThe weekly bond chart looks like a big bear flag. If it is, the objective is under 130'00 !

Bond futures signaling a recession?Bonds are at a long term trendline and may be signaling a rush into bonds in months ahead.
This makes me approach equities very cautiously right now.
$TLT

30-year bond futures ZB1! is testing DeMarks yearly S1 pivot poi30-year bond futures is testing Demarks Yearly S1 pivot point. So far this year, DeMarks Yearly pivot(P) to the yearly S1 pivot point.


T-Bond Futures (ZB1!), H1 Bearish DropType : Bearish Drop
Resistance : 149'12
Pivot: 148'14
Support : 146'14
Preferred case: With price expected to reverse off the ichimoku resistance, we see the potential for bearish drop from our Pivot level at 148'14 in line 61.8% Fibonacci retracement towards our 1st support level at 146'14 in line with the horizontal swing low support.
Alternative scenario: If price breaks out, it can potentially move towards our 1st resistance level at 149'12 which is in line with 78.6% Fibonacci retracement and horizontal swing high resistance.
Fundamentals: Economic risks from inflation and tightening monetary policy causes bearish sentiments around the bonds market.

T-Bond Futures (ZB1!), H1 Bearish DropType : Bearish Drop
Resistance : 147'30
Pivot: 146'27
Support : 145'23
Preferred case: We see the potential for bearish drop from our Pivot level at 147'30 in line 23.6% Fibonacci retracement towards our 1st support level at 148'24 in line with 78.60% Fibonacci projection and 161.8% Fibonacci extension is. Our bearish bias is supported by how price is moving below the Ichimoku indicator.
Alternative scenario: If price breaks out, it can potentially move towards our 1st resistance level at 147'30 which is in line with 100% Fibonacci projection and horizontal swing high resistance.
Fundamentals: Economic risks from inflation and tightening monetary policy causes bearish sentiments around the bonds market.

Long entry in monthly chart Everyone in the market is waiting for the inverting yield curve. Yields forming a top equals a bottom in bond prices, due to its inverted correlation.
We entered a long term support channel since 2000 with a little RSI-divergence in the weekly chart.
The risk reward in phenomenal with a reward/risk ratio of 35.
This is a long term trade, but a highly profitable if it plays out correctly.

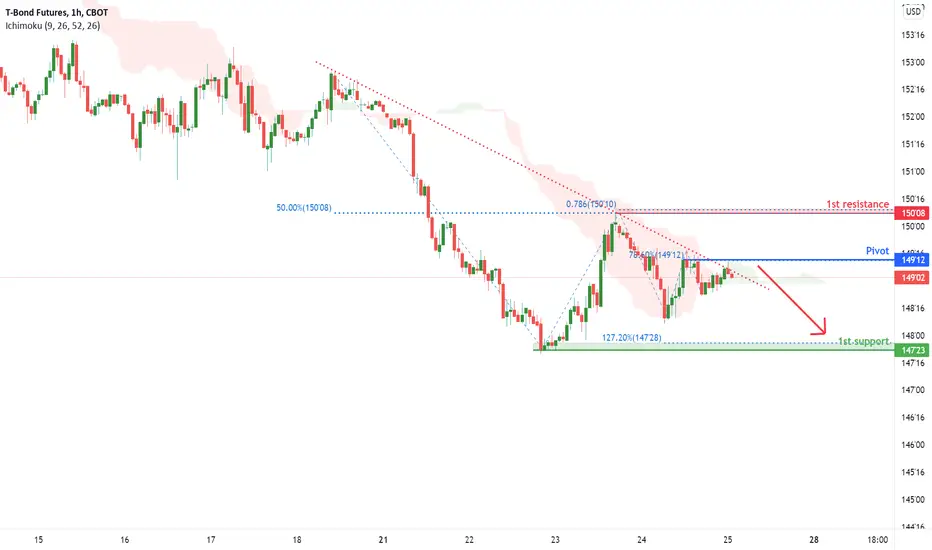
T-Bond Futures (ZB1!), H4 Potential for a drop!Type: Bearish drop
Resistance : 15008
Pivot: 14912
Support : 14723
Preferred case: With price moving close to the ichimoku cloud resistance, we have a bearish bias that price will drop from our Pivot at 14912 in line pullback resistance and 78.60% Fibonacci retracement towards our 1st support at 14723 in line with the latest swing low support and 127.20% Fibonacci retracement.
Alternative scenario: If prices were to reverse, price may potential rise towards our 1st resistance at 15008 which is in line with the pull back resistance and 78.6% Fibonacci retracement level.
Fundamentals: Federal Reserve officials warn steeper rate hikes may be necessary to subdue the hottest inflation in four decades which causes investors selling their bonds.

T-BOND FUTURESA good, strong rise because it rolled over the incredibly hacked resistance and very likely back to the previous summit.

ZB1! (10 Year T-bonds ) , H1 Bearish dropType: Bearish drop
Resistance: 154'13
Support: 151'09
Pivot: 153'11
Preferred case: With price expected to reverse off the stochastic indicator and ichimoku cloud, we have bearish bias that price will drop from our pivot of 153'11 in line with the horizontal swing high resistance to our 1st support of 151'09 in line with the horizontal swing low support and 78.6% Fibonacci projection.
Alternative Scenario : Alternatively, price may break pivot structure and head for 1st resistance at 154'13 in line with the horizontal overlap resistance and 127.2% Fibonacci extension.
Fundamentals: With the uncertainty of the RUSSO-UKRAINE conflict and the implications on the US economy due to increase increase sanctions. Bond prices will continue to increase as increase frequency of rate hikes seems more unlikely. As fundamentals and technicals align, ZB1! might be a good opportunity to look into.

ZB1! (10 Year T-bonds ) , H4 Bearish dropType: Bearish drop
Resistance: 153'11
Support: 150'16
Pivot: 151'30
Preferred case: With price moving below the ichimoku cloud , we have bearish bias that price will drop from our pivot of 151'30 in line with the horizontal overlap resistance to our 1st support of 150'16 in line with the horizontal swing low support and 78.6% Fibonacci projection .
Alternative Scenario : Alternatively, price may break pivot structure and head for 1st resistance at 153'11 in line with the horizontal swing high resistance.
Fundamentals: With the uncertainty of the RUSSO-UKRAINE conflict and the implications on the US economy due to increase increase sanctions. Bond prices will continue to increase as increase frequency of rate hikes seems more unlikely. As fundamentals and technicals align, ZB1! might be a good opportunity to look into.

ZB1! (10 Year T-bonds ) , H4 Bearish dropType: Bearish drop
Resistance: 153'11
Support: 150'16
Pivot: 151'30
Preferred case: With price moving below the ichimoku cloud, we have bearish bias that price will drop from our pivot of 151'30 in line with the horizontal overlap resistance to our 1st support of 150'16 in line with the horizontal swing low support and 78.6% Fibonacci projection.
Alternative Scenario : Alternatively, price may break pivot structure and head for 1st resistance at 153'11 in line with the horizontal swing high resistance.
Fundamentals: With the uncertainty of the RUSSO-UKRAINE conflict and the implications on the US economy due to increase increase sanctions. Bond prices will continue to increase as increase frequency of rate hikes seems more unlikely. As fundamentals and technicals align, ZB1! might be a good opportunity to look into.

ZB1! (10 Year T-bonds ) , H4 Bearish dropType: Bullish Rise
Resistance: 156'01
Support: 152'02
Pivot: 150'15
Preferred case: With price expected to bounce from the stochastic indicator, we have bullish bias that price will rise from our pivot of 150'15 in line with the horizontal swing low support to our 1st resistance of 156'01 in line with the horizontal pull back resistance and 50% Fibonacci retracement.
Alternative Scenario : Alternatively, price may break pivot structure and head for 1st support at 152'02 in line with the horizontal swing low support.
Fundamentals: With the uncertainty of the RUSSO-UKRAINE conflict and the implications on the US economy due to increase increase sanctions. Bond prices will continue to increase as increase frequency of rate hikes seems more unlikely. As fundamentals and technicals align, ZB1! might be a good opportunity to look into.


Short term heading lowerRejected by the 20 period line in the hourly chart. Next support is the green line below.

ZB1! possible long tradeZB1!: looking at a long trade with a small stop, BUT! we will "go digging in the weeds" as one of my mentors in the past would say. If you don't get some of it, don't worry...the process is very repetitive. Try to get 2 bits of information that you think might be useful each time...and be patient.

ZB1! (10 Year T-bonds ) , H4 Bearish dropType: Bearish drop
Resistance: 152'02
Support: 155'27
Pivot: 154'22
Preferred case: With price moving below the ichimoku cloud , we have bearish bias that price will drop from our pivot of 154'22 in line with the horizontal pullback resistance to our 1st resistance of 152'02 in line with the horizontal swing low support and 161.8% Fibonacci extension .
Alternative Scenario : Alternatively, price may break pivot structure and head for 1st support at 155'27 in line with the horizontal pullback resistance.
Fundamentals: With the uncertainty of the RUSSO-UKRAINE conflict and the implications on the US economy due to increase increase sanctions. Bond prices will continue to increase as increase frequency of rate hikes seems more unlikely. As fundamentals and technicals align, ZB1! might be a good opportunity to look into.

ZB1! Part23.12.22 ZB1! Part 2 This video and Part 1 were about reading price action and looking for reversals. If you scalp, you trade the market differently than if you are taking long term positions. If you are trading longer term, you get long at the 1.272 and hold for a higher target and a stop below your entry.


ZB1! (10 Year T-bonds ) , H4 Bearish dropType: Bearish drop
Resistance: 159'22
Support: 151'22
Pivot: 156'00
Preferred case: With price moving below the ichimoku cloud , we have bearish bias that price will drop from our pivot of 156'00 in line with the 23.6% Fibonacci retracement to our 1st resistance of 159'22 in line with the horizontal swing low support.
Alternative Scenario : Alternatively, price may break pivot structure and head for 1st support at 151'22 in line with the 100% Fibonacci projection level.
Fundamentals: With the uncertainty of the RUSSO-UKRAINE conflict and the implications on the US economy due to increase increase sanctions. Bond prices will continue to increase as increase frequency of rate hikes seems more unlikely. As fundamentals and technicals align, ZB1! might be a good opportunity to look into.

ZB1! (10 Year T-bonds ) , H4 Bearish dropType: Bearish drop
Resistance: 159'22
Support: 151'22
Pivot: 156'00
Preferred case: With price moving below the ichimoku cloud, we have bearish bias that price will drop from our pivot of 156'00 in line with the 23.6% Fibonacci retracement to our 1st resistance of 159'22 in line with the horizontal swing low support.
Alternative Scenario : Alternatively, price may break pivot structure and head for 1st support at 151'22 in line with the 100% Fibonacci projection level.
Fundamentals: With the uncertainty of the RUSSO-UKRAINE conflict and the implications on the US economy due to increase increase sanctions. Bond prices will continue to increase as increase frequency of rate hikes seems more unlikely. As fundamentals and technicals align, ZB1! might be a good opportunity to look into.
