Title :ZB1! ( 10 Year T-bond) , H4 bullish continuation Title :ZB1! ( 10 Year T-bond) , H4 bullish continuation
Resistance: 159'26
Pivot: 155'19
Support: 154'11
Preferred case: Price is near pivot level of 155'19 in line with 50% Fibonacci retracement and can potentially go to the graphical swing high level of 159'26 in line with 100% Fibonacci projection. Our bullish bias is supported by the ichimoku cloud indicator.
Alternative scenario: Price dip to the support level of 154'11 in line with 1272% Fibonacci retracement and 61.8% Fibonacci projection.
Fundamentals: With the uncertainty of the RUSSO-UKRAINE conflict and the implications on the US economy due to increase increase sanctions. Bond prices will continue to increase as increase frequency of rate hikes seems more unlikely. As fundamentals and technicals align, ZB1! might be a good opportunity to look into.
ZB1! trade ideas

ZB1! (10 Year T-bonds ) , H4 Bullish continuationType: Bullish continuation
Resistance: 163'18
Support: 157'24
Pivot: 159'16
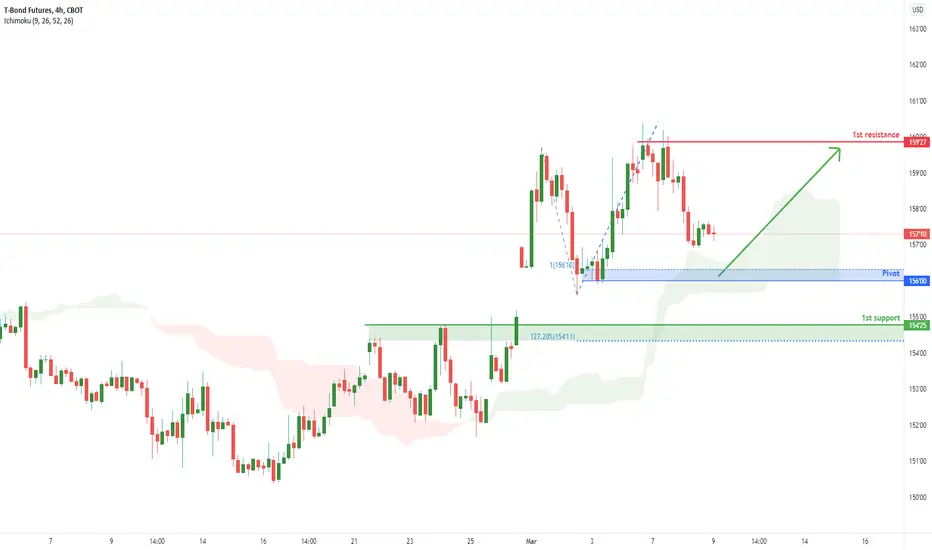
Preferred case: With price moving above the ichimoku cloud , we have a bias that price will rise from our pivot of 156'00 in line with the 100% Fibonacci projection to our 1st resistance of 159'27 which is also the graphical swing high resistance.
Alternative Scenario : Price may dip to the support level of 154'25 in line with 127.2% Fibonacci extension level.
Fundamentals: With the uncertainty of the RUSSO-UKRAINE conflict and the implications on the US economy due to increase increase sanctions. Bond prices will continue to increase as increase frequency of rate hikes seems more unlikely. As fundamentals and technicals align, ZB1! might be a good opportunity to look into.

ZB1! (10 Year T-bonds ) , H4 Bullish continuation Type: Bullish continuation
Resistance: 163'18
Support: 157'24
Pivot: 159'16
Preferred case: With price moving above the ichimoku cloud, we have a bias that price will rise from our pivot of 156'00 in line with the 100% Fibonacci projection to our 1st resistance of 159'27 which is also the graphical swing high resistance.
Alternative Scenario : Price may dip to the support level of 154'25 in line with 127.2% Fibonacci extension level.
Fundamentals: With the uncertainty of the RUSSO-UKRAINE conflict and the implications on the US economy due to increase increase sanctions. Bond prices will continue to increase as increase frequency of rate hikes seems more unlikely. As fundamentals and technicals align, ZB1! might be a good opportunity to look into.
10 year T-Bonds (ZB1!) , H4 Potential for bullish bounceTitle : 10 year T-Bonds (ZB1!) , H4 Potential for bullish bounce
Type: Bullish bounce
Resistance: 159'16
Pivot: 156'16
Support: 155'01
Preferred case: Price near buy entry level of 156'16 in line with 38.2% Fibonacci retracement and 78.6% Fibonacci projection. Price can potentially bounce from this level to the resistance level of 159'16 in which is also the graphical swing high level. Our bullish bias is supported by the ichimoku cloud indicator.
Alternative scenario: Price dip to support level of 155'01 in line with 50% Fibonacci retracement and 78.6% Fibonacci projection.
Fundamentals: With the uncertainty of the RUSSO-UKRAINE conflict and the implications on the US economy due to increase increase sanctions. Bond prices will continue to increase as increase frequency of rate hikes seems more unlikely. As fundamentals and technicals align, ZB1! might be a good opportunity to look into.

T-BOND FUTURESThe arrow has gone down pretty hard, and it's now inside a strong area of inversion, and it's moving out of this area. We can determine its direction.

ZB!1 sellbraking of the purpel square and the strong selling volume means a possible dive for the market

10 year T-Notes (ZB1!) H4 potential for bullish bounce Title : 10year T-Notes(ZB1!), H4 potential for bullish bounce
Type : Bullish bounce
Resistance: 159'04
Pivot : 156'05
Support : 155'02
Preferred case: Price is near pivot level of 156'05 in line with 38.2% Fibonacci retracement and 61.8% Fibonacci projection. Price can potentially go to the 1st resistance level of 159'04 in line with 78.6% Fibonacci projection. Our bullish bias is supported by the stochastic indicator as it is at support level.
Alternative scenario: Price dip to support level of 155'02 in line with 50% Fibonacci retracement and 78.6% Fibonacci projection
Fundamentals: With RUSSO-UKRAINE conflict escalating , Treasury prices may increase as investors look into safe haven assets. As fundamentals and technicals align, it is a good opportunity when looking in to ZB1! .

10 year T-note Futures ( ZB1! ) , H4 potential for bearish dipTitle: 10 year T-note Futures ( ZB1! ) , H4 potential for bearish dip
Type: Bearish Dip
Resistance : 161'08
Pivot : 160'11
Support : 156'19
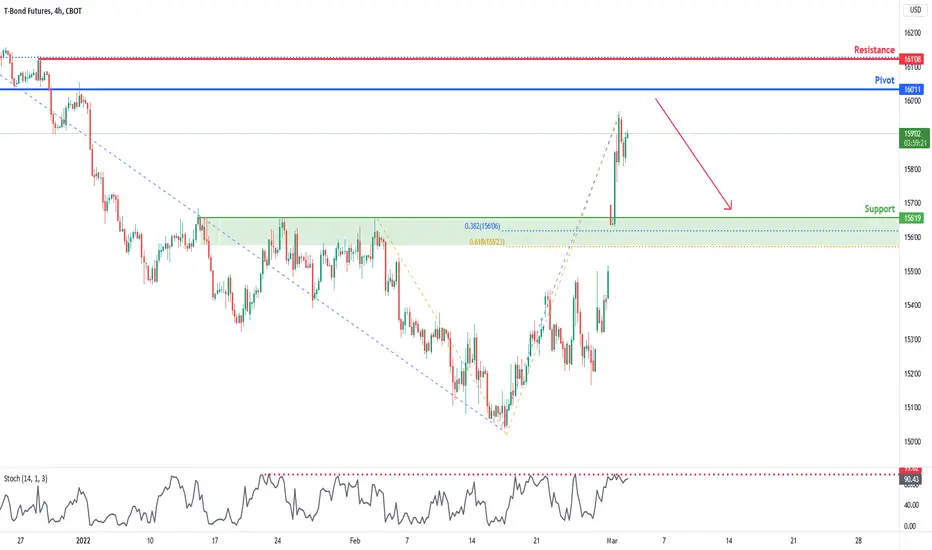
Preferred Case: Price is near pivot level of 160'11 which is also the graphical overlap resistance. Price can potentially dip to the support level of 156'19 in line with 38.2% Fibonacci retracement and 61.8% Fibonacci projection. Our bearish bias is supported the stochastic indicator as it is at resistance level,
Alternative scenario: Alternatively price go to the resistance level of 161'08 in line with 78.6% Fibonacci retracement.
Fundamentals: The US has repeatedly stress that US troops will not be directly involved in the conflict between Russia and Ukraine. However, the ramifications faced by the US due to heavy sanctions on Russia is not fully realized. Prices of bonds may continue to increase as investors continue to flee to safe haven assets. As technicals and fundamentals do not align , there is a risk on factor when looking in to ZB1!.
10 year T-note Futures (ZB1!) , H4 potential for bearish dip Title: 10 year T-note Futures (ZB1!) , H4 potential for bearish dip
Type: Bearish dip
Resistance: 157'08
Pivot: 156'19
Support: 154'13
Preferred case: Price is near pivot level which is also a key graphical overlap resistance. Price can potentially dip to the support level of 154'13 in line with 61.8% Fibonacci retracement and 78.6% Fibonacci projection. Our bearish bias is supported by the stochastic level as it is at resistance level.
Alternative scenario: Price can break this key graphical overlap level and go to the 1st resistance level of 157'08 in line with 50% Fibonacci retracement.
Fundamentals: With RUSSO-UKRAINE conflict escalating , Treasury prices may increase as investors look into safe haven assets. As fundamentals and technicals do not align, there is a risk on factor when looking in to ZB1!.

MAI Chart T-Bond futuresI jungled around with different MAI values and figured out you could use them, as buy-sell indicator, there are like RSI but more accurate, The top/sell MAI is on 200/20 and the buy MAI is on 185/7.4 and the close MAI on 10/5, I am sure that you can tweak those around and make it more accurate.
-> working on a pine script that makes them automatically

10 Year T-Note Futures ( ZB1! ) , H4 | Potential for dropOn the H4, with price approaching the resistance of the RSI indicator, we have a bias that price will drop to our support at 152'01 in line with the horizontal swing low support from our pivot at 154'10 in line with the 78.6% Fibonacci retracement and horizontal overlap resistance. Alternatively, price may break pivot and head for 1st resistance at 156'06 in line with the 127.2% Fibonacci extension .

10 Year T-Note Futures ( ZB1! ) , H4 | Potential for dropOn the H4, with price approaching the resistance of the RSI indicator, we have a bias that price will drop to our support at 152'01 in line with the horizontal swing low support from our pivot at 154'10 in line with the 78.6% Fibonacci retracement and horizontal overlap resistance. Alternatively, price may break pivot and head for 1st resistance at 156'06 in line with the 127.2% Fibonacci extension.

10 Year T-Note Futures (ZB1!) , H4 potential for bounceTitle: 10 Year T-Note Futures ( ZB1! ) , H4 potential for bounce
Type: Bullish bounce
Resistance : 154'10
Pivot: 152'09
Support : 151'08
Preferred case: Price has recently bounce from pivot level of 152'09 in line with 61.8% Fibonacci retracement and 100% Fibonacci projection . Price can potentially go to resistance level of 154'10 in line with 78.6% Fibonacci retracement . Our bullish bias is supported by the moving average as price is trading above it.
Alternative scenario: Price can potentially dip to the support level of 151'08 in line with 127.2% Fibonacci projection .
Fundamentals: With the Russo-Ukraine conflict escalating to an all out war, prices of bonds will continue to increase as investors flock to safe haven asset. Technicals and fundamentals align, thus ZB1! may be a good opportunity to look into .

10 Year T-Note Futures (ZB1!) , H4 potential for bounce Title: 10 Year T-Note Futures (ZB1!) , H4 potential for bounce
Type: Bullish bounce
Resistance : 154'10
Pivot: 152'09
Support : 151'08
Preferred case: Price has recently bounce from pivot level of 152'09 in line with 61.8% Fibonacci retracement and 100% Fibonacci projection. Price can potentially go to resistance level of 154'10 in line with 78.6% Fibonacci retracement. Our bullish bias is supported by the moving average as price is trading above it.
Alternative scenario: Price can potentially dip to the support level of 151'08 in line with 127.2% Fibonacci projection.
Fundamentals: With the Russo-Ukraine conflict escalating to an all out war, prices of bonds will continue to increase as investors flock to safe haven asset. Technicals and fundamentals align, thus ZB1! may be a good opportunity to look into .

10 Year T-Note Futures (ZB1!) , H4 due for bearish dipPreferred cases: Price is near pivot level of 153'15 in line with 38.2% Fibonacci retracement . Price can potentially dip to the take profit level of 151'08 in line with 127.2% Fibonacci projection and 78.6% Fibonacci retracement . Our bearish bias is supported by the stochastic indicator as it is near resistance level .
Alternative scenario: If price were to continue its rally, it can potentially rise to the 1st resistance level of 154'10 which is also our graphical swing high resistance.
Fundamentals : With the Russo-Ukraine conflict escalating to an all out war , prices of bonds will continue to increase as investors flock to safe haven assets. Technicals and fundamentals do not line up thus there is a risk on factor when looking into ZB1!

10 Year T-Note Futures (ZB1!) , H4 due for bearish dip Type : Bearish Dip
Resistance:154'10
Pivot:153'15
Support: 151'08
Preferred cases: Price is near pivot level of 153'15 in line with 38.2% Fibonacci retracement. Price can potentially dip to the take profit level of 151'08 in line with 127.2% Fibonacci projection and 78.6% Fibonacci retracement. Our bearish bias is supported by the stochastic indicator as it is near resistance level.
Alternative scenario: If price were to continue its rally, it can potentially rise to the 1st resistance level of 154'10 which is also our graphical swing high resistance.
Fundamentals : With the Russo-Ukraine conflict escalating to an all out war , prices of bonds will continue to increase as investors flock to safe haven assets. Technicals and fundamentals do not line up thus there is a risk on factor when looking into ZB1!

A Story About Simplicity and Moving Average Envelopes CBOT:ZB1!
First, a short story. I like simple stuff. Maybe it's just me (I don't think so) but the more complex my process becomes, the worse the trading results. In 1987, four years into my career, I used a combination of Wyckoff and Elliott to make a series of very profitable bond market calls for my institutional clients. I spent my days and nights obsessed with counts, counter counts, alternate counts, Wyckoff sequences, oscillator nuances…. In other words, all the shiny complex things were in play. Needless to say, I came out of the experience a legend…. in my own mind. In retrospect, I had loads of confidence but very limited real knowledge or experience. It's counter intuitive, but the success of 1987 was detrimental to my growth as a trader/analyst.
After the great results/luck during the tumult of 1987, 1988 proved difficult. My Elliott count became muddied, I often misread the Wyckoff price volume relationships and while not disastrous, my results turned quite ordinary. As the results worsened I responded by adding ever more complexity to what was an already complex routine. To make a long story short, as complexity increased, results worsened. To suggest that I became frustrated would be an extreme understatement. I questioned my future as a technician/trader.
I remember walking into my office one morning after a particularly bad week and deciding that things had to change. I decided to immediately begin simplifying my process. I retreated to basics. Happily for me, as I eliminated complexity I found better results. Over the next few years I continued to simplify and to refine my risk management approach. By simplifying and becoming less risk tolerant I became an effective trader/analyst. Simplicity is robust, it is typically fractal, and reduces difficult decisions to ordinary. Simplicity is also a process. Most only arrive there after a long journey.
Moving average envelopes certainly fall into this "simple is simply better" approach.
• Construction is simple and intuitive.
• Construction is easily adapted for any market or time frame.
○ This is important because every market has a specific character. Some trend for long periods while others chop and mean revert with regularity.
○ Importantly, character changes over time. It had been four years since I last updated my bond moving averages, the changes were significant.
○ Part of this probably has to do with the level of Fed involvement. I don't think I had significantly updated my bond envelopes for nearly thirty years prior to this adjustment.
○ Part of this has to do with the level of interest rates. At lower levels of rates, prices are generally more volatile as durations (a measure of rate sensitivity) become longer.
○ Because the envelope construction is revisited periodically it remains current to changes in market state and condition.
○ Don't assume that envelope settings that work on 30 year futures will work on 10s or 5s. Differences in duration create large differences in volatility
○ Also, the settings that work well on futures won't translate to yields. Using percent change (envelope tops and bottoms are placed at percentages of the moving averages) on a percentage is just wrong. I see supposedly financially literate people do this all the time… what the hell?
Building the Envelopes:
• The average and the width of the band is an eyeball approximation. Nothing fancy.
• Choose one of the available moving average envelope studies available. I used one created by H-potter.
• Set average 1 up so that the upper and lower bands follow the price action closely.
• Set average 2 up so that the upper and lower bands generally tag the next higher perspective swing points.
• Set the third average up so that the upper and lower bands tag the highs and lows of the next more volatile set of swings.
• I often add a fourth set of bands that tag the next higher perspective highs and lows.
• Don't get carried away. Keep it simple and intuitive.
• I am intentionally not providing my settings. I don't think they are important but I think its important for you to go through the process for the particular market and time frame you are working in.
How I use the Envelopes:
• Convergence of the upper or lower bands suggest that the market has become overbought or oversold.
• Odds of correction, even if laterally, expand significantly when the band extremes converge.
• You would never buy or sell based upon the convergence. But you might reduce a long/short position or begin monitoring for reversal behaviors as the bands come together.
• I generally use the warning of an extended trend given by the bands to begin closely monitoring price action, searching for tradable setups with good risk reward characteristics.
Conclusion: Simplicity can provide a real edge while complexity often becomes a headwind to success. This simple moving average envelope system can be modified for nearly any market or time frame and is adaptive over time.
Good Trading:
Stewart Taylor, CMT
Chartered Market Technician
Shared content and posted charts are intended to be used for informational and educational purposes only. The CMT Association does not offer, and this information shall not be understood or construed as, financial advice or investment recommendations. The information provided is not a substitute for advice from an investment professional. The CMT Association does not accept liability for any financial loss or damage our audience may incur.

ZB1! H4 | Potential for bullish continuationPrice is near pivot level of 152'21 in line with 50% Fibonacci retracement . Price can potentially go to the 1st resistance of 154'09 which is also the graphical swing high level. Our bullish bias is supported by the ichimoku cloud indicator as price is trading above the clouds. Alternatively, Price can dip to the 1st support level of 151'15 in line with 78.6% Fibonacci retracement .

ZB1! H4 | Potential for bullish continuationPrice is near pivot level of 152'21 in line with 50% Fibonacci retracement. Price can potentially go to the 1st resistance of 154'09 which is also the graphical swing high level. Our bullish bias is supported by the ichimoku cloud indicator as price is trading above the clouds. Alternatively, Price can dip to the 1st support level of 151'15 in line with 78.6% Fibonacci retracement.

ZB1! H4 |Bullish continuation Type: Bullish continuation
Resistance : 156'17
Support : 151'07
Pivot : 153'29
Preferred Case : Price is near pivot level of 153'29 in line with 161.8% Fibonacci projection and 61.8% Fibonacci retracement. Price can potentially go to the 1st resistance of 156'17 which is also the graphical swing high level. Our bullish bias is supported by the ichimoku cloud indicator as price is trading above the clouds
Alternative scenario : Price can dip to the 1st support level of 152'17 in line with 38.2% Fibonacci retracement and 61.8% Fibonacci projection
Fundamentals: As russo-ukraine tensions continue to escalate, bond prices will continue to increase with investors flocking to safe haven assets.

ZB1! H4 | Potential for bearish dipType: Bearish continuation
Resistance : 153'30
Support : 151'07
Pivot : 1513'15
Preferred Case : Price is trading in a descending channel and near pivot level of 153'15 in line with 50% Fibonacci retracement and 127.2% Fibonacci projection . Price can potentially dip to the 1st support level of 151'07 in line with 78.6% Fibonacci retracement and 78.6% Fibonacci projection . Our bearish bias is supported by the ichimoku cloud indicator.
Alternative scenario : If prices continue to rally. Price can potentially dip to the 1st support level of 151'07 in line with 78.6% Fibonacci retracement and 78.6% Fibonacci projection .
Fundamentals: As russo-ukraine tensions continue to escalate. Bond prices will continue to increase as investors flock to safe haven assets. As fundamentals and technicals do not align, there is a risk factor when looking into ZB1!

ZB1! H4 | Potential for bearish dip Type: Bearish continuation
Resistance : 153'30
Support : 151'07
Pivot : 1513'15
Preferred Case : Price is trading in a descending channel and near pivot level of 153'15 in line with 50% Fibonacci retracement and 127.2% Fibonacci projection. Price can potentially dip to the 1st support level of 151'07 in line with 78.6% Fibonacci retracement and 78.6% Fibonacci projection. Our bearish bias is supported by the ichimoku cloud indicator.
Alternative scenario : If prices continue to rally. Price can potentially dip to the 1st support level of 151'07 in line with 78.6% Fibonacci retracement and 78.6% Fibonacci projection.
Fundamentals: As russo-ukraine tensions continue to escalate. Bond prices will continue to increase as investors flock to safe haven assets. As fundamentals and technicals do not align, there is a risk factor when looking into ZB1!

Are Bonds Turning Up Part IIn 2018 the bond turned upward once it went about 5 points out of its 28 year downtrend. Once again in 2022, it went about 5 points out of the channel and COULD be forming an early head and shoulders POSSIBLE reversal pattern. I suspect a lot of macro is coming together to bring a turnaround in bond prices. Raul Paul of Real Vision made this call in 2018 which was an amazing "pound the table" call when a double bottom presented the place of a the bound rebound. Not sure this is quite that yet, but it has potential.
