ZB1! trade ideas

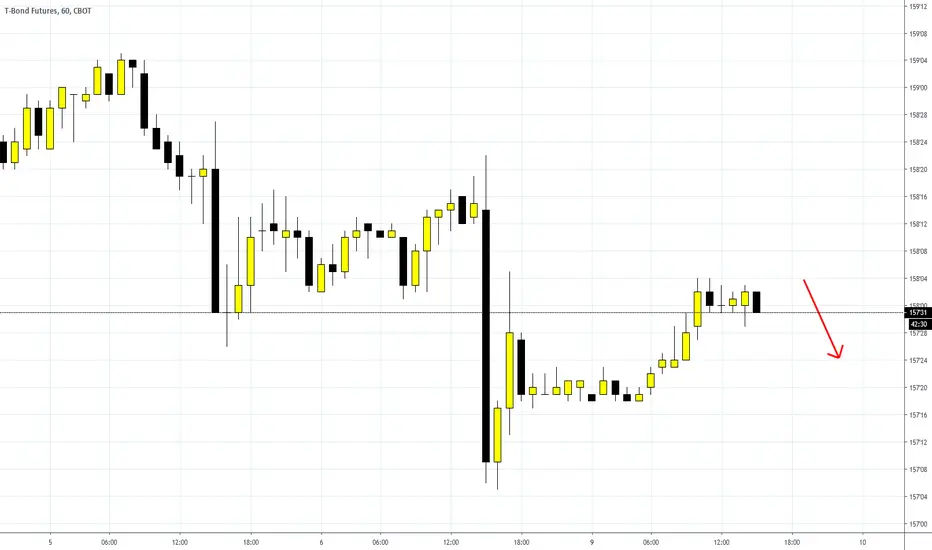
T-BOND FUTURES this is my prediction for the next move on the ZB1! Futures Chart . even if it look bearish but the market still have the power to go look for those point 287-290


ZB--30 yr Bond nearing end of Blow-off top30-Yr bond very close to end of bull market--Looking for top very short term.

US 30yr bondsI have bee looking for 186 level on bond futures (100% Fib extension of waves 1 through 3). Fell just a tad short on the spike this evening. May be enough for now at least s/t....smells like we may be getting a washout trade (unless of course a fin instn bank or fund is the wrong way round and leveraged up the wazoo....in which case 2008 redux here we come)

Unsustainable move in Bond Futures.Just because the news media is crazy doesn't mean that stable people should go crazy! This too, will pass.

30 year bonds ZB at Yr230 year bond futures today, is testing the Yearly r2 pivot point. Look for strong resistance here.


A top in sovereign bonds.CBOT:ZB1!
As $13 trillions of debt are trading at a negative yield worldwide and even 10 years US Treausury Notes are trading at a negative real yield , this contrarian trade is completely vulnerable to further central banks action. BUT.
Looking at a long term chart of long term US yields, it just happens that it exhibits a quite clear falling wedge pattern and that we are, right now, at inflection point: either yields go up or we'll have a breakout to the downside, with the possibility of having even nomina l negative interest rates in the US. I still think that that won't happen, so I'll take my chances in shorting bonds with a stop loss above the pick of July 2019.

treasury short squeezeWell coordinated timing/price confluence in the 30year treasury. It was a perfect setup right at the start of new year until jan 31 when the high fib extension was reached. It may revert back to the lows shortly.


Long 20/30 Year Bonds $TLT $IEFWe are finally breaking this big wedge I have been monitoring for awhile. Last week we had a big $TLT print that was just huge.
Jan 14
📈 $TLT
📊 6,683,190 😱
💵 138.82
We are well above that now and I think a big move is coming.

ZB potential moon target ~200So far after periods of long consolidation, the ZB has targetting the 1.618-2.0 fibonacci extension of the prior peak to trough distance. If we apply the same logic here, the move up might just be mid-way now.
Trade carefully.
Educational post only. Follow at your own risk

Long BONDS? Bond futures strength could spell S&P 500 weaknessThe recent upside in the bond market has been in tandem with the upside in the S&P 500. The move higher in bonds is largely due to the lower rates in monetary policy. Which should not directly affect long-term bonds by much but they have had some effect. Over the past three months, Bonds have gone down while the S&P 500 has made a lot of gains.
The 30-year bonds should rebound at the previous broken high which should hold as support. Max, the move may go down to the 50% retrace level based on the Fib retracement before rebounding. Till the retrace opens up we could see more upside in the equity market. The long extended wicks near support suggest the bond buyers coming in a pop above the recent high into all-time highs could crush the S&P 500.
There is a chance that the bond market continues to drop through the support levels, the opening upside for the equity market. This is the tail end of bond investments that have grown exponentially over the last year.
Correlations in markets are pivotal to identifying the current economic cycle on a longer-term perspective.

ZB (bonds)Bonds same position as gold. I think the lows may be in. As long as we continue to hold above this zone I think buying pulls backs is fine. We break this then Bonds are in a real downtrend.

Nice safe haven Bonds bull flag! Gold is forming a bull flag, Bonds are also and equities market show signs of topping and exhaustions...
Just an idea, not a trade advice ...


Bearish bond idea30 year Bonds are now at the top end of a multi-year downward channel. Keep in mind that bonds do tend to follow channels and trend lines over the long term. If this channel holds bonds may be in for significant selling into 2020 and beyond all the way down to the bottom of the channel.
