ZB - T-Bond ReactionPrice landed back on the blue A/R line.
I see two possible ways:
1) Up and turn at the Centerline, then down to the L-MLH
2) Jump above the Centerline, quick test of it and then up to the "Scene Of Crime", how Shane would say
For now, a play up to the Centerline would not be too shaby.
Happy 2017 to all of you!
P!
ZB1! trade ideas

T-Bond within a few weeks of MAJOR buy on 128H oscillator?rwilday noticed some good scalp buys this week from Fractal Resonance Composite lines on a 30 minute ZB chart and (facetiously) asked if it was time to buy big. In this case the 30-minute chart gives too narrow a view, but we can find the dominant timescale candidate on the 8H chart's 128H oscillator (FR_COMPONENT timescale multiplier=16). It's lead line is -87% oversold but still tilted down. Another 2-6 weeks may be needed before it flattens and crosses up with bold green dot -0.59% for a potentially MAJOR bi-weekly or monthly buy. The case for local 128H dominance will be strongest then if the 256H lead line (row below) has also flattened WITHOUT reaching its green shade zone.

SuperBull play on BondsWith clear divergence and a clear break of the EMA I expect Bonds to recover back up a little. Adding some positive deltas to my current positions on bonds, I will Buy The 164/166 Call Debit spread and Sell the 162 Put to finance the cost. That would put our break even below the Weakly trend line.
Max Profit $2,171.88
Break even at 161'21
76% of profit

ZB1. Long the waterfallDespite ZB1 can tecnically go lower, I will try to call a bottom here. Surely, Donald Trump´s election haven´t been a cause of today´s movement but indeed accelerated the things.
Will long on opening, with a SL order set at 152. TP1: 170, TP2: 185
Notice bullish divergence on Weekly Timeframe and also bullish divergence on Daily Timeframe


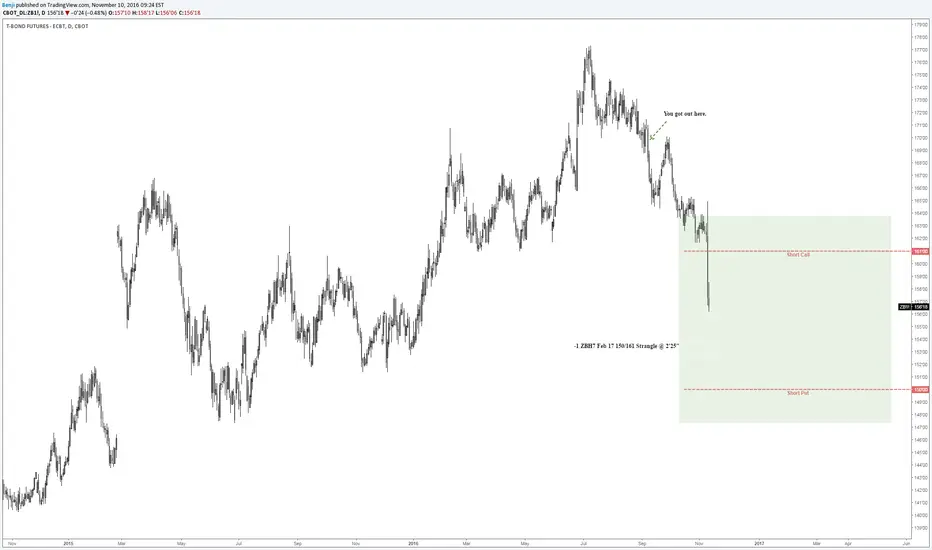
/ZB StrangleSelling IV in Bonds....
I meant to sell Jan, but sold Feb instead...oh well. Here's the trade:
-1 ZBH7 Feb 17 150/161 Strangle @ 2'25"
Max Profit = $2,390.63
Risk: 2 Std. Dev. outside strikes
Going for 50% profit as target
ZB1. T-Bond futures. Long room to goZB1 futures show that the T-Bonds are finishing the correction which started back in July and are ready for one more leg up.
Also, it would confirm that there will be no rate hike in December abd bond market would rally to a new historical highs before a big crash.
Will long at 161´21 targeting 182 ish in a term of 4-6 months.

ZB - Bonds potentially bounce on the centerlineThis big fork seems to catch the extremes and center of the Bonds.
Centerline is reached and the potential that it will bounce from there is really high.
If I would want to play this underlying, I would switch to TLT...
P!


***Long Opp***Notes on chart.
Futures trading involves significant risk of financial loss and is not suitable for every investor.


Bear DVG on Large Suuport LineCaution - 163'25 would have to clean break, test first.
Typically this would be a buy spot (weekly lows)
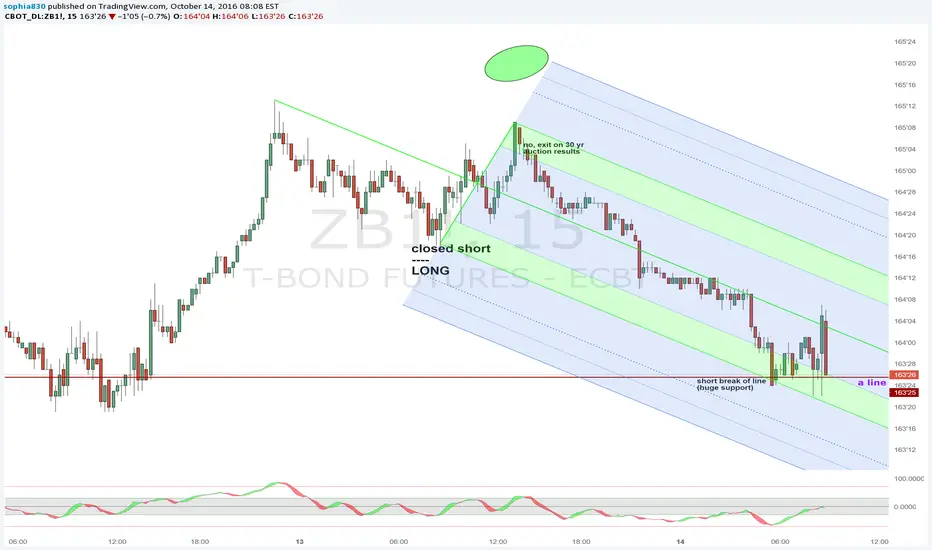


Bonds - \ZBBonds recently completed a 9 week right triangle and stayed below with Friday's close. I am personally not in the trade - not every market opinion you have warrants a trade, I have learned.
A measured target for this move would be near the 164.25 area.


ZBLooking for some nice symmetrical moves as can be seen by the blue advance lines and red retracement lines.
`also the fib retracements at 50% and 61.8%

Covered Call setupLooking to take advantage of the next move up I bought a covered call. Long 1 Futures sell 1 (175 call)


ZB1!, ZN1! Bonds - Shortthe economy is extremely gloomy, the latest job created is only 38k
bloods on the streets, nothing to buy?
Short 10yrs and 30yrs treasury bond
*this is not an advice for you to enter
i have some SL in mind

Bonds WaitingWill short on retest of extreme if break out of minor channel shows liquidation. Right now, I'm just waiting. Targets reached
