ZF1! trade ideas


ZF1! P-Modeling Pt 1. 5 Year T-Note Futures. Extreme CajunZF1! 5 Year T-Note Futures. Extreme Prediction Modeling Architecture on a One Week Time-frame.
The following chart is an very experimental Extreme Long Range Prediction Model, using quantum graphing decoding protocols that were developed to tease out very complex long-range modeling architectures... This has mostly common sense schematics outlined..
Find the 5 year cycle patterns.
Decode the Matrix Residual from those patterns.
Copy/Paste correct residuals into hyperspace.
Gather Geometric Support thru Regression/Vector blueprints of ecosystem.
Post idea and wait...
I honestly see this to be apart of a historic correlation with the SPX...
I do not expect to be right. Fully..
But, this is potentially a full ecosystem reset ... A Recession Cycle..
Laugh now... Cry Later.. Doubt is an illusion to the truth... Doubt now, Laugh Later.. Love Everything.
Failure is a necessary component of success. ;)
Welcome to the Hyperspace and thanks for pondering the unknown with me,
Glitch420

US Treasuries Performance - 1 YRIf negative rates are set to accelerate, it's important to look at the corresponding treas. performance over the past year.

ZF Range Bound ShortZF is caught in a range and has hit the top of the range according to daily support and resistance lines. Potential profit at middle minor resistance / mid range (yellow line) or at the lower daily support (black line).

5 YEAR T-NOTE FUTURES (MAR 2019), 1D, CBOTTrading Signal
Short Position (EP) : 114.65625
Stop Loss (SL) : 114.9375
Take Profit (TP) : 113.625, 112.984375
Description
ZFH2019 formed Double Repo Sell at 1d time frame. Trade setup with Sell Limit at 0.382 Level (114.65625) and place stop after 0.618 level (114.9375). Once the position was hit, place take profit before an agreement (113.625) and 112.984375
Money Management
Money in portfolio : $280,000
Risk Management (1%) : $2,800
Position Sizing
$0.0078125 = +-$7.8125
Commission fee = -$3.04
EP to SL = $0.3 = -$281.25
Contract size to open = 10 standard contracts
EP to TP#1 = $1 = +$1,031.25
EP to TP#2 = $1.7 = +$1,671.88
Expected Result
Commission Fee = -$30.4
Loss = -$2,812.5
Gain#1 = +$5,156.25
Gain#2 = +$8,359.38
Total Gain = +$13,515.63
Risk/Reward Ratio = 4.75


I found an interesting $ZF post of mine from 2017Please check the link below to see the earlier post. In 2017 I draw a bearish flag break on the Monthly chart, with a clear technical measured target. Now check again the recent weekly chart. Target reached.
Conclusions:
- never fight against a major trend
- go with the trend (I did not ride it fully, but at least I did not have any strategic long positions at all :-) )
- Just because it reached a measured target, it doesn't mean price cannot drop further. We are light years away from a strategic bullish reversal in US bond market, and also quite far away from any type of swing long setup by the Daily chart.

5 Year US Treasury Futures - Shorting opportunity5 Year US Treasury Futures - Shorting opportunity
End of B wave in an ending diagonal, potentially going lower.

A Bullish breakout to come?- Price is trying to step out of the cloud, but it is still within the trading range
- Future Kumo is flat and thin: neutral picture with minor bullish bias
- haDelta+ bullish bias above mid line
- haOscillator may deliver a bullish signal too.
- EWO has bullish bias

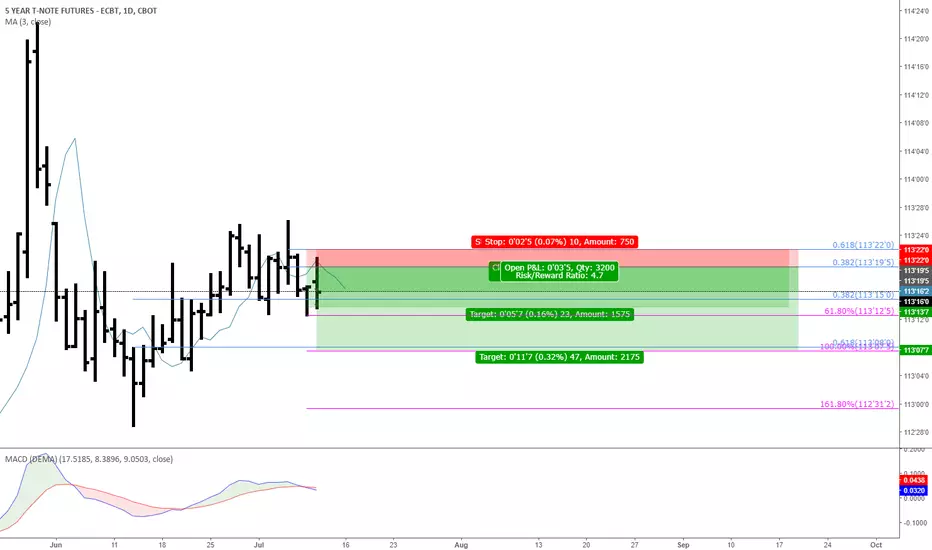
5-Year T-Note Futures ZFU2018 ,D1Trading Signal
Short Position (EP) : 113.5546875
Stop Loss (SL) : 113.6484375
Take Profit (TP) : 113.28125,
Description
ZF formed Double Repo Sell at 1d time frame. Trade setup with Sell Limit at 0.382 Level (113.5546875) and place stop after 0.618 level (113.6484375). Once the position was hit, place take profit before an agreement (113.28125) and
Money Management
Money in portfolio : $48486
Risk Management (1%) : $484.86
Position Sizing
$0.001 = +-$1 (Standard)
Commission fee = -$1.52/contract (Standard)
EP to SL = $0.1 = -$93.75/contract (STD)
Contract size to open = 5 standard contracts
EP to TP#1 = $0.3 = +$273.44 (STD)
EP to TP#2 = $0 = +$0 (STD)
Expected Result
Commission Fee = -$15.2
Loss = -$468.75
Gain#1 = +$1367.19
Gain#2 = +$0
Total Gain = +$1367.19
Risk/Reward Ratio = 2.83

5 Year T-Note Futures SEP 2018 (1d)Trading Signal
Short Position (EP) : 113.609375
Stop Loss (SL) : 113.6875
Take Profit (TP) : 113.4296875, 113.2421875
Description
INT formed Double Repo Sell at 1d time frame. Trade setup with Sell Limit at 0.382 Level (113.609375) and place stop after 0.618 level (113.6875). Once the position was hit, place take profit before an agreement (113.4296875) and 113.2421875
Money Management
Money in portfolio : $133,000
Risk Management (1%) : $1,330
Position Sizing
$1 = +-$1000
Commission fee = -$12.16/contract
EP to SL = $0.1 = -$78.13/contract
Contract size to open = 15 standard contracts
EP to TP#1 = $0.18 = +$179.69
EP to TP#2 = $0.37 = +$367.19
Expected Result
Commission Fee = -$364.8
Loss = -$1,171.88
Gain#1 = +$1,437.5
Gain#2 = +$2,570.31
Total Gain = +$4,007.81
Risk/Reward Ratio = 2.61
ZF1! - Inside bar formed & looking for a false break-outPrice continues to consolidate with the 5 year notes. On the daily chart we can see a large mother bar with 2 child bars. We are currently watching a 3rd bar form which looks like it may want to break out to the upside. If this happens it may be setting up for a very bearish pattern called an inside bar fake-out or false break-out. That is when you have an inside bar pattern form and finally breakout one direction only to have the market immediately pull back into the inside bar. This fakes a lot of traders to trade with the break out and the pullback then traps and squeezes them. Price then breaks out the other direction and the squeeze helps accelerate and feed the move. In a strong bearish trending market I am only looking for opportunities to get short. If price breaks out to the upside I will be watching for a pullback and for the inside bar false break-out pattern on the daily chart.
