Why Soybean Oil Outperforms Crude Oil?From their recent lows, soybean oil has quietly crept up by 50%, while crude oil has risen by 40%. The reason goes beyond the recent renewal of tensions in the Middle East — it runs deeper than that.
Mirco SoybeanOil Futures
Ticker: MZL
Minimum fluctuation:
0.02 per pound = $1.20
Disclaimer:
• What presented here is not a recommendation, please consult your licensed broker.
• Our mission is to create lateral thinking skills for every investor and trader, knowing when to take a calculated risk with market uncertainty and a bolder risk when opportunity arises.
CME Real-time Market Data help identify trading set-ups in real-time and express my market views. If you have futures in your trading portfolio, you can check out on CME Group data plans available that suit your trading needs www.tradingview.com
Trading the Micro: www.cmegroup.com
www.cmegroup.com
ZLF2018 trade ideas

Why the Sudden Surge in Soybean Oil Prices?Recent sharp increases in Chicago soybean oil prices reflect a confluence of dynamic global and domestic factors. Geopolitical tensions, particularly those impacting crude oil markets, have played a significant role, as evidenced by the recent surge in Brent crude futures following events in the Middle East. This volatility in the broader energy complex directly influences the cost and strategic value of alternative fuels, positioning soybean oil at the forefront of this market shift.
A primary driver of this ascent is the transformative policy initiatives from the U.S. Environmental Protection Agency (EPA). The EPA's proposed Renewable Fuel Standard (RFS) volume requirements for 2026 and 2027 represent an aggressive push towards increased domestic biofuel production. These mandates, significantly exceeding previous targets, aim to bolster U.S. energy security and provide substantial support for American agriculture by boosting demand for soybeans and their derivatives. Key changes, such as the transition to RIN equivalents and reduced RIN costs for imports, are designed to further incentivize domestic consumption and reshape market dynamics.
This policy-driven demand fundamentally reorients the U.S. soybean oil market, causing Chicago Board of Trade futures to increasingly reflect internal American forces rather than global trends. This necessitates a shift in focus for traders towards physical market prices in other regions for international insights. The market has reacted swiftly, with notable increases in futures prices, a surge in open interest, and record trading volumes, indicating strong investor confidence in soybean oil's role within this evolving landscape. Concurrently, the new mandates exert pressure on imported biofuel feedstocks, further solidifying the emphasis on domestic supply.
Ultimately, the rise of soybean oil prices signifies more than just market speculation; it marks a pivotal transformation. It positions soybean oil as an essential commodity within the U.S.'s energy independence strategy, where robust domestic demand, shaped by forward-looking policy, becomes the prevailing force. This transition underscores how intertwined agricultural markets now are with national energy objectives and global geopolitical stability.

Soybean Oil LongZL1! is not net long on the regression break.
The roll long on this pair is (-0.40%). I am not taking this trade.

Soybean OilTo me the view is pretty clear. In 2026 we may see 75$
* The purpose of my graphic drawings is purely educational.
* What i write here is not an investment advice. Please do your own research before investing in any asset.
* Never take my personal opinions as investment advice, you may lose your money.

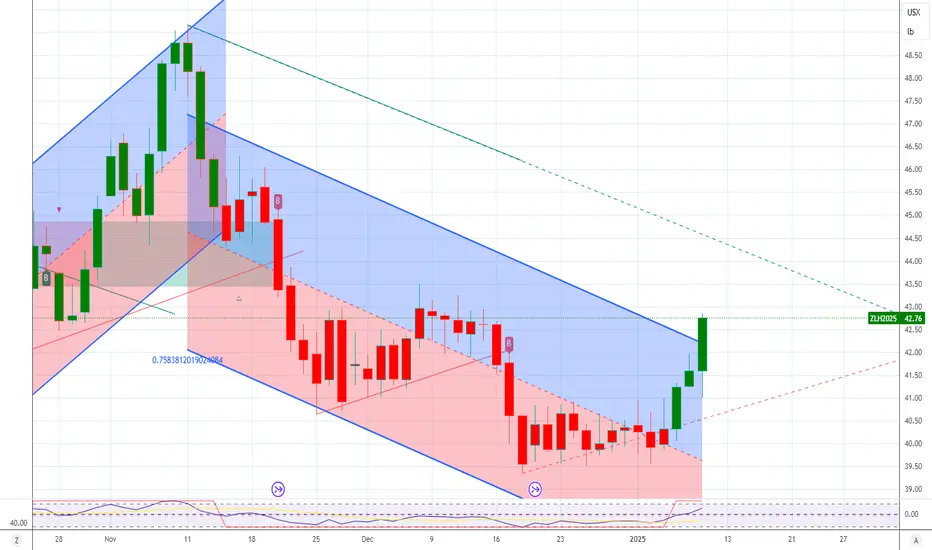
Soybean Oil Futures: Bearish Retest Signals Further Downside
The price is now failing to maintain above the short-term moving average, hinting at weak bullish follow-through.
ZLN2025 is showing signs of exhaustion after an uptrend, with bearish pressure increasing. If bulls fail to reclaim $49.00, the next leg could favor a continuation downward toward $46 and lower.
Price broke below the short-term moving average (20 EMA) and is now testing it as resistance.
This type of retest often precedes continuation of the down move.

Soybean Oil ShortSoybean Oil is now short on the regression break.
The roll short is +1.3% on the front month, but then flat on the following months.
There maybe a short term trader for a couple %.

SOYBEAN Oil Futures LongZL1! is now net long the regression break.
The front month roll is current +1.2% in favour of a long position.
I am considering this trade.

Oil Bitcoin3.10.25 in this video I look at a number of markets but the most notable is that oils probably ready to go lower but it's a hard trade to Short for me. a Bitcoins setting up for a reversal higher I believe, and I will explain that in the video.

Soybean Oil Futures ShortZL1! is now net short on Regression break downwards
This commodity has (+1.4%) monthly roll short.
I am considering this trade

ZLH 15m Long 2025-01-20 10:50PM Maybe I should call this a 5m timeframe. I did my analysis on a 15m, but refined my zones on a 5m.
Also, I was doing my analysis late on the 20th, and was seeing my target as the upper curve. If I had taken that trade, I would have wanted to follow with my stop, but I was about to go to sleep, so if my entry was filled, I wouldn't have been able to manage the trade, so I went to sleep. Upon further analysis the following morning, I realized that, by looking for a target on the 5m, I would have found a good target for a limit order.
So if I had been able to stay awake, this would have been my setup:
- Upper curve found on 1h on Jan 15: *** 46.53-17.10 ***
- Lower curve found on 1h at 1am Jan 9: *** 41.27-41.05 ***
- Entry zone: 45.81-45.77
- Target zone: 46.12-46.33
My question is: Would that have been a good trade based on solid analysis, or am I just seeing in hindsight that it *would* have worked, and tailoring my analysis to fit what the market actually did but based on weak data? Like maybe my profit zone should have been drawn based on the high on 1/16 at 06:30 or so?

Review of the markets1.15. 25 I went through a few markets today and I wanted you to see the repetitive nature of certain trade signals and I will explain this in more detail in the video. I always look for trades with a small stop..... I always look for 2 bar reversals. if you can get into a trade with a small stop and it moves in the direction of that stop because it's a two-bar reversal you will find that many of your trades will be profitable and that most of your trades will not stop you out at least for a while. the entries are systemic and you should expect to look at markets that you calculate will go in a certain direction with a small stop... but sometimes you don't want to take the trade because you're just not certain of that.... and it's okay to walk away from a trade because you don't lose money if you don't take a trade. what happens when you make an effort not to be so impulsive that you must take a trade this gives you a chance to study the market without impulsive trade decisions when the Market's not clear enough. learn from a trade that looks like it might work but you didn't like it enough to take the trade. you'll get better at it but if you trade every trade that comes along regardless of your conviction you're learning to trade impulsively and that's going to lose your money and stop you from Trading the market because it doesn't take too many losing trades before you conclude that it's not worth it. when you enter a trade you should have a Target and a stop..... some trades if you look for the buyers and the sellers will automatically tell you when you don't have a good trade when you approach it when you look for where the buyers and the sellers are at the time your contemplating an entry.

Head & Shoulders trap on Soybean OilSoybean Oil has drawn a nice Head & Shoulders pattern. After breaking the neckline, the market should have fallen - but it did the opposite, it's rising. Now, short sellers are trapped, and the market is set to punish them. They have stop losses in obvious places - TARGET 1 is the minimum the market is going to hit. TARGET 2 is very probable in my opinion; long term, Soybean Oil is in an uptrend, and the H&S failure was the Bears' last breath.

SOYBEAN OIL Future (ZL!) Long on Regression BreakSoybean Futures are running a (-1%) monthly roll long and its within the consolidation of last couple of months.
I won't take this trade and although there maybe a couple of % in it. It's just a hard grinned.
Soybeans to be flipped in the weekly pan!We have entered into acceptance with a previous range's value and also got rejected into its POC. Up next is the VAL as the support
Presented are two setups. 7.17 short and 7.09 long.

Soybean Oil : A potential bull phasePrice retreated 0.786% of the entire bull run and confluence with wave C supporting at 0.618 of wave A presents a call for closer scrutiny. The upswing displayed a 5 wave overlapping sequence which can be interpreted as a leading diagonal wave 1. Implication is highly probable bullish.
A third attempt breakout above the trendline retreated back under the trendline was a wet blanket. However, market appears intact. A move above 49.16 will increase the probability further upside.

Soybean Oil - 50 years chart, what do you see?Let's look at Fibonacci levels. The attached chart, on a logarithmic scale, spans over 50 years - that's huge! The market just bounced from the 61.8% level, confirming that the bulls are still alive. Let's switch to a lower timeframe in the next post to see if anything interesting is happening there.

Soybean Oil - ultra big pictureSoybean Oil:
- 1970-1974: Prices rose from $8.6 to $48 = ~ 450% increase
- 1974-2000: Sideways movement between $15-$40
- 2000-2008: Bull market, prices surged from $15 to $70 = ~ 350% increase
- 2008-2020: Retracement to $25
- 2020-2022: Another bull market, prices went up from $25 to $87 = ~ 250% increase
- 2022-2024: Retracement to $38
But has the retracement ended? You never know, but at some point, it will, and current price levels are quite interesting. Check the next message for more

Soybean Oil // bearish expansion phaseAll 3 major timeframes (MN, W, D) are bearish, and the market is in a short expansion phase.
The idea is valid while the daily is waving south.

GoldMonday I talked about a number of markets here but I focused on the gold market because it took a $9000 reversal lower. this really is not a big deal but there are ways that you can spend your time efficiently make trade decisions that will be beneficial for you..... in this particular case if you'd use the 2 bar reversal Not only would you have gotten out of a long trade but you might even consider a long trade..... depending on whether or not you think like a buyer or a seller. I ran out of time on this video and it was a little sloppy at the end of the video.... I will try to make amends for that when I have time.

Soybean oil Sunday night review . the market looked like it was going higher for a while but it did almost a complete reversal of the Swing we were looking at last week so that's what we were looking for in the video.

Soybean Oil’s Red Pill Moment: The Short Signal Just Hit"You’ve been waiting, watching, wondering when the veil would lift. Today is that day."
Soybean oil just crossed a threshold, one that turns theory into action. This isn't just a hint anymore; it’s a red pill moment. Today, we got the confirmation we needed: a Daily bearish momentum divergence trigger has sealed the deal. If you've been waiting for a sign, here it is—the entry point is here.
Decoding the Signs from the Commitment of Traders (COT)
"What if I told you that the market leaves clues? And only the most discerning see them."
Our strategy isn’t based on surface-level movements but on patterns and signals that tell the deeper story. Soybean oil is primed for a down move. Let’s break down the intel:
Commercials’ Short Stance
Relative to their positioning over the last 26 weeks, commercials have positioned themselves heavily short. Last time they were this committed was December 2023, a setup that spelled trouble for the long side.
Overvaluation Across Key Metrics
Against gold and treasuries, soybean oil is flashing overvalued based on our WillVal indicator. This isn’t random; the market is overextended and vulnerable to the downside.
Bearish “Pinch” Confirmation
Two weeks ago, a Bearish Pinch formed on ADX/Stochastic—one of the most reliable indicators of an impending pullback. Today’s momentum divergence confirms it. The alignment is uncanny, if you’re paying attention.
Seasonal Trends: Down to December
True Seasonal points down, favoring the bears. It’s as if time itself is backing this move.
Supplementary Indicators Are Aligned
Insider Acc/Dis, %R, and Stochastic are all signaling in unison: the tide is turning. Each of these alone is meaningful, but together, they mark a rare convergence that few recognize.
"The trigger is pulled, and now we walk the path."
This isn’t a drill. Today’s bearish momentum divergence confirmation is the daily trend trigger we needed, a line in the sand between potential and execution. For those who see beyond the surface, this is your sign to take action.
To uncover more of these market signals and gain the insights no one else is sharing, follow @Tradius_Trades. Because once you’re in on the code, everything changes.

Soybean Oil : Are we in a wave 3 of 3 of 3???Looking closer at the smaller structure, it appears very excitably bullish. The upside potential is highly probable. An impulsive push should validate the 3 of 3 of 3. Technical indicators are supportive too.

Soybean oil10.25.24 soybean oil is trading in a Range box but the general pattern looks as if it's going to make newer highs despite a two-bar reversal at the time of this video that suggests that the Market's going to go a little bit lower first.
