ZL1! trade ideas


SOYBEAN OIL Traders, if you liked this idea or have your opinion on it, write in the comments. I will be glad

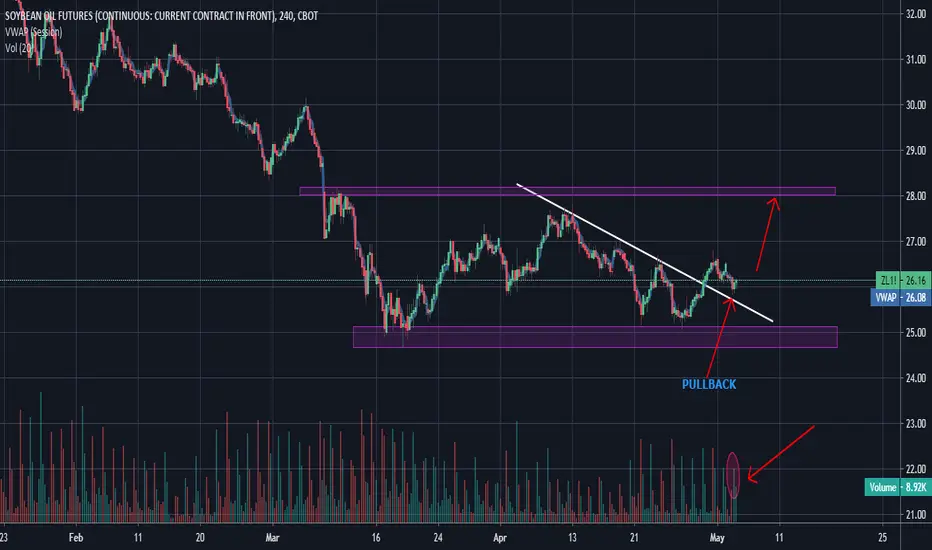
My Soybean oil futures analysis • If the market breaks the resistance line with a big green candle, we have a high probability to get a bullish trend again
Otherwise it's a pullback, the market will return to the red support line, in this case and it's highly probable to break it and getting a bearish trend.

ZL1We have a downtrend
The market has broken the downtrend and retested it so there will be a possibility of an upside.
if you liked this idea or have your opinion on it, write in the comments.
DISCLAIMER: As a trader you should consider your own risk:reward ratio and do proper lot sizing according to your margin and leverage level. Not every idea is a valid trade. This analysis is a trading idea, not a trading signal for you.
ZL ANALYSE
After a bullish trend which started since May 2019, At the end of January 2020 we break the support. On February 6 there is a pull back and then a bearich trend begins.Since March the market has been trying to come back.Now if we break 26.80 we can reach 27.50 ,and if we break 27.50 with force the next target 28.50

My Expectation For the #ZL1For ZL1! My Expectation is going up cuz the price respect the ORANGE level also if the price beak the 25.65 this will confirm this expectation

ZL1 Soybean Oil Cont short term LONG soon I see a LARGE ABC down with a short term bullish Gartley forming in green advancing to $30 ish (B leg), then June into August bearish completion at $19 possible $15 entry to Long.
I admit I have not traded Soybean Oil but twice and this is forecasting out pretty far so take my view with a grain of salt. Soybeans & Soybean oil do not appear the same. I'm seeing
possible Deflation with the drop in CL leading the way. CL going negative in May spells trouble.

Next target 28.48We are looking for an up move on Soybean oil , it has finished bigger structure. Will start to look for buy setups .
Next target will be 28.48 and 30 come next. Look for buy set up base on your analysis.
Future trading is a risky business, what we are sharing is only our point of view on what could be the next move in the market and not signal. Please make your own analysis before follow us. Trade with care

cot report long SOY OILmajor support resistence. I am anticipating a cot index of around 100 possibly in a couple of weeks.
Riskier tha usual from fundamental stand point but very good potential entry point for major trend reversal

Soybean oil significant downtrend possibly endingThis is a long position based on the principles of demand. These zones form when leftover buy orders are not filled by investors. When price returns to these levels, the buyers regain their positions and attempt to push the price up again.
The volume profile indicator shows us where the heaviest volumes are located. It is relevant due to the fact that a quality demand zone is in the same position as the heaviest volumes. As a scalper, we look to take advantage of the small movements on these higher time frame zones. A 1 to 1 profit will suffice.

soyoil short cotShort cot on soyoil, 35 at linear trend, 39 average down on log trend. around 10% take profit

Sell Spread ZLN2020-ZLZ2020 Soybean Oil Commodity FuturesWe look as a first thing at the spread indicator which is a trend following indicator and suggests if the direction of the Soybean Oil spread is bearish or bullish .
When the red line is above the green line the indicator is suggesting that the spread is bearish .
Before to enter short, we look at the seasonality indicator as well to receive a confirmation.
The seasonality indicator is suggesting that the Soybean Oil market is 92 % bearish .
Because both indicators are bearish , in our opinion an opportunity is coming for short positions and you may consider to sell the spread ZLN2020-ZLZ2020
If you seasonality indicator would have suggested a bullish market for the Soybean Oil ,
that would have meant that the spread ZLN2020-ZLZ2020 would have been out of seasonality and therefore we would have avoided the trade.
We look to our RS indicator to identify support and resistance levels.
According to our strategy, the support and resistance can be used respectively to set our take profit and stop loss

Long Term Prospects for SOY BEAN OILThe SOY BEAN OIL, symbol ZL, is in a Bear Market Rally with price trading above the 50 week ema, but the 50 ema below the 200 and 800 week emas. The 50 and 200 emas are starting to turn up, so price is starting to come out of accumulation / distribution. The price action appears to be finishing up the c-wave of a c-wave up, within a multi-year x-wave. This last week ended in a doji with a long wick up showing the rejection of higher prices. This is your indication showing the market is entering a period of consolidation where the emas start coming together.
The Market is in a Bear Market Rally on the daily, with price above the 50 ema, which is above the 200 and 800 emas, with the 200 ema still below the 800 ema. Price is topping out with three pushes up in this wave, and dark clouds and shooting stars warning of a top.
The Market is in a Bull Market on the 4 hour, with price trading above the 50 ema, which is above the 200 ema, which is above the 800 ema. Price is correcting having dropped below the 13 ema and having tested the 30 ema twice. There is also a big old nasty shooting star which makes for a good peak formation. Probably open down next week and trade up towards the back end of the coming week to finish out an M-Top formation, before starting a sideways consolidation, which will likely be a triangle.
This is my SOY BEAN OIL look ahead for my own trading purposes. FUTURES trading involves risk. Feel free to comment, but trade off of this post at your own peril.

Great month for ZLIncrease of 17 percent since start of December. Volatility is coming back for soybean oil futures. I would like to wish all of traders a happy new year and happy trading in year of 2020. Find a method that suit your personality. Feel free to message if you have any difficulties in trading.

Short of SBOIntermediate wave 12345 (yellow) is a triangle diagonal.
Minor ABC (purple) of intermediate wave 4 (yellow) almost completed.
Intermediate wave 5 (yellow) begins sooner.
Stoch RSI showed line cross uptrend will be ended soon.

Textbook Soybean Meal ZL! ForecastI don't know what quite else to say!
My previous Idea unfolding into the bigger picture!

SoyBEANS? NAH- SOYBEAN OIL!!!Rocking in a parabolic fashion.
"Ask Bevis- I get nothing butthead"
RIP BIG L


