$ZL_F Soybean oil futures breakout out of bullish flagSoybean oil futures set to run up from this level. Confirmed with increase in volume.
ZL1! trade ideas


Soybean Oil (ZL): July 18th 2019Decision area : 27.60 - 27.70
1. In order to bolster the ending diagonal idea (as per ZL analysis on July 8th 2019), price needs to trade way below 27.54
2. If price is not able to decisively pierce through the decision area, the 3-drive pattern may unfold.
#contengconteng #zl #soybeanoil

Soybean Oil (ZL): Daily EW Count - July 11th 2019An ending diagonal could be voided if ZL further develops into a 3-drive pattern. #contengconteng #zl #soybeanoil


Soybean Oil (ZL): Weekly EW CountAn ending diagonal is likely currently developing.
#contengconteng #zl #soybeanoil


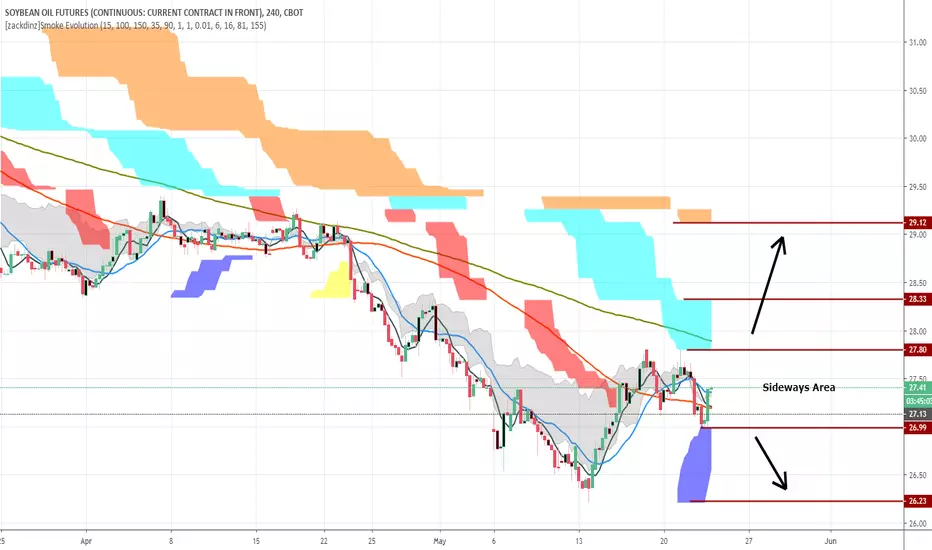
ZL. technical analysisPrice may remain in sideways mode in range of 27.80 to 26.99. Price should go beyond the range to be in buy or sell mode. Refer chart.

Soybean Oil - Long Term Projectionmarket looks going downward for a while before it moves spike up. Otherwise if its failed to break the important level, will continue downtrend


Soybean Continues Uptrend, approaching fibo target 423sbo already reach and breaks 261 fibo level, so according to rule it shud hit level fibo 423


