ZL1! trade ideas


ZL Soybean Oil, short term correction, 60Price is supported at c line. There is a chance of rebound and if not, it will go down further to next support.

SOYBEAN OIL FUTURES (MAR 2019), 1D, CBOTTrading Signal
Short Position (EP) : 30.62
Stop Loss (SL) : 30.91
Take Profit (TP) : 30.04
Description
ZSH2019 formed Double Repo Sell at 1d time frame. Trade setup with Sell Limit at 0.382 Level (30.62) and place stop after 0.618 level (30.91). Once the position was hit, place take profit before an agreement (30.04)
Money Management
Money in portfolio : $1,000,000
Risk Management (1%) : $10,000
Position Sizing
$0.01 = +-$ 6.00/std-contract
Commission fee = -$5.64/contract (Standard)
EP to SL = $0.29 = -$174
Contract size to open = 57 standard contracts
EP to TP = $0.58 = +$348
Expected Result
Commission Fee = -$321.48
Loss = -$9,918
Gain = +$19,836
Risk/Reward Ratio = 1.91

SOYBEAN OIL FUTURES (MAR 2019), 1D, CBOTTrading Signal
Short Position (EP) : 28.8
Stop Loss (SL) : 29.08
Take Profit (TP) : 28.24
Description
ZLH2019 formed Turtle Soup Sell at 1d time frame. Trade setup with Sell Limit at 0.382 Level (28.8) and place stop after 0.618 level (29.08). Once the position was hit, place take profit before an agreement (28.24)
Money Management
Money in portfolio : $280,000
Risk Management (1%) : $2,800
Position Sizing
$0.01 = +-$ 6.00/std-contract
Commission fee = -$5.64/contract (Standard)
EP to SL = $0.28 = -$168
Contract size to open = 16 standard contracts
EP to TP = $0.56 = +$336
Expected Result
Commission Fee = -$90.24
Loss = -$2,688
Gain = +$5,376
Risk/Reward Ratio = 1.9

Strong Resistance (Long)Price should break the black line(MA) before it can go further. smoke indicator shows uptrend still intact..
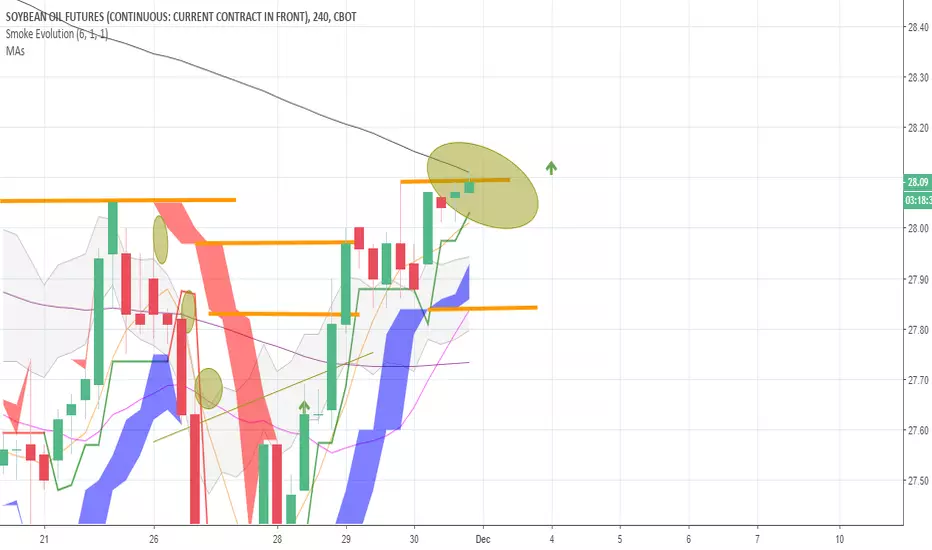
Smoke EvolutionIntroducing the evolution of smoke indicator. i called it smoke evolution. from the chart, it indicates that price will go for different level of price that indicates by indicator. blue and red band is replacing the box as entry, exit and stop. Follow next analysis...

Bullish Bat ZL Z18Bullish Bat PRZ completed because price already hit min PRZ 161.8 BC (27.86) Target Profit at 38.2-61.8.


Kathy Lien Double Bollinger Band Strategy.As per Kathy Lien's Double Bollinger Band Strategy, here we can see a short opportunity as the price action has broken and closed below the 20 day, 1 standard deviation band. We take the open, or as i do the low of the previous close plus 1 tick for a short sell stop order.
Initial stop loss once in the trade is 1 tick about the 15 day simple MA and I aim for a profit target of 1.6 times entry and stop loss difference.


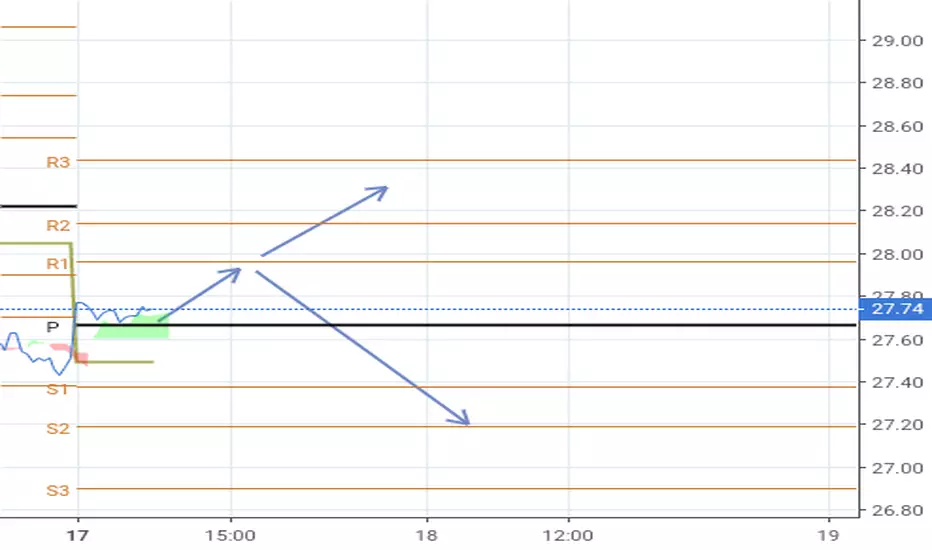
ZL weekly targetprice will go up until R1. if price is fail to break R1. market will continue downtrend.


Targest hit. Wait for confirmation on breakout points.Both TP = 30.14 and 29.44 hit as the previous bearish Channel aggressively broke earlier and met the targets much earlier than I expected. Soybean Oil has now entered a new Channel Down on 1D, which is coming off a Lower High (hence Highs/Lows = 0, RSI = 51.334). We now need to wait for confirmation from the two break-out points (illustrated by the circles). If the upper point breaks then we will go long (TP = 28.99 and 29.44). If the lower point breaks then we will go short (TP = 26.51).

Short Soybean Oil at 27.93More strength down. Shorting from 27.93
I do not like to short with the prices being already depressed from recent tariff war between USA and China, but I have to following the price movement.
I would use a stop of 28.80 and see how far the price will move down.

SOYBEAN OIL FUTURES, 1D, CBOTTrading Signal
Short Position (EP) : 28.72
Stop Loss (SL) : 28.98
Take Profit (TP) : 27.92, 27.43
Description
ZL formed Double Repo Sell at 1d time frame. Trade setup with Sell Limit at 0.382 Level (28.72) and place stop after 0.618 level (28.98). Once the position was hit, place take profit before an agreement (27.92) and 27.43
Money Management
Money in portfolio : $150000
Risk Management (1%) : $1500
Position Sizing
$0.01 = +-$ 6.00 (Standard)
Commission fee = -$2.82/contract (Standard)
EP to SL = $0.26 = -$156/contract (STD)
Contract size to open = 9 standard contracts
EP to TP#1 = $0.8 = +$480 (STD)
EP to TP#2 = $1.29 = +$774 (STD)
Expected Result
Commission Fee = -$50.76
Loss = -$1404
Gain#1 = +$2400
Gain#2 = +$3096
Total Gain = +$5496
Risk/Reward Ratio = 3.78


Soybean Oil (ZL): Monthly EW CountIt is already 10 years since commodities super cycle took commodity markets to the all time high and soybean oil (ZL) market has been in the corrective period ever since. In a monthly chart, we could see that the correction of larger degree takes in the form of flat correction (3-3-5). As far as supply and demand (SnD) is concerned, there are 2 demand zones of interests
1. demand zone #1 (23.46 - 25.34)
2. demand zone #2 (18.83 - 20.84)
Technically, wave (3) of V of C is currently developing and could extend its tail to 24.00 level or below. With the trade war between the USA and China is on the brink of being fully developed, the market dipping to the 19.00 level is not really a far fetched projection.
