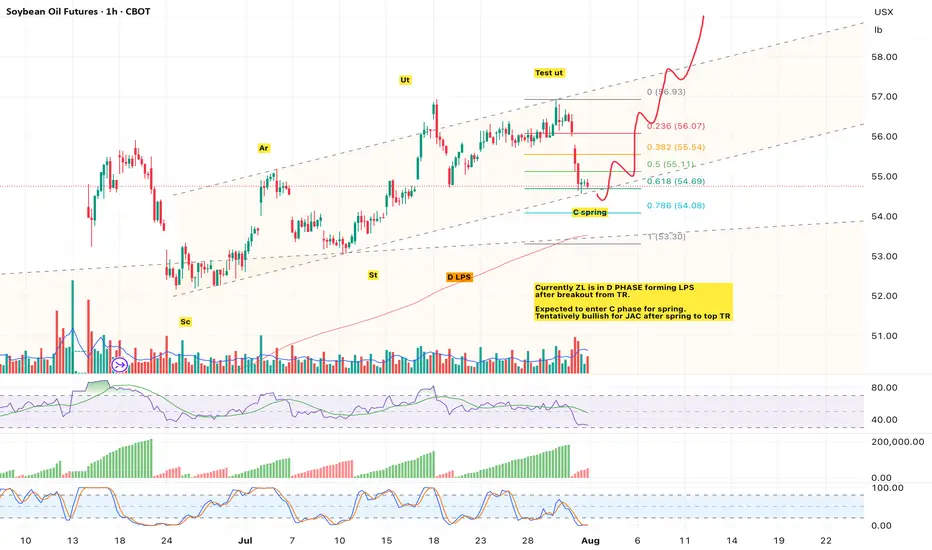
ZL ON LAST POINT OF SUPPORTExpected to enter C phase and rebound to top TR for JAC before continuing markup.
Contract highlights
Related commodities
Why Soybean Oil Outperforms Crude Oil?From their recent lows, soybean oil has quietly crept up by 50%, while crude oil has risen by 40%. The reason goes beyond the recent renewal of tensions in the Middle East — it runs deeper than that.
Mirco SoybeanOil Futures
Ticker: MZL
Minimum fluctuation:
0.02 per pound = $1.20
Disclaimer:
•

Why the Sudden Surge in Soybean Oil Prices?Recent sharp increases in Chicago soybean oil prices reflect a confluence of dynamic global and domestic factors. Geopolitical tensions, particularly those impacting crude oil markets, have played a significant role, as evidenced by the recent surge in Brent crude futures following events in the Mid

Soybean Oil LongZL1! is not net long on the regression break.
The roll long on this pair is (-0.40%). I am not taking this trade.

Soybean OilTo me the view is pretty clear. In 2026 we may see 75$
* The purpose of my graphic drawings is purely educational.
* What i write here is not an investment advice. Please do your own research before investing in any asset.
* Never take my personal opinions as investment advice, you may lose your m

Soybean Oil Futures: Bearish Retest Signals Further Downside
The price is now failing to maintain above the short-term moving average, hinting at weak bullish follow-through.
ZLN2025 is showing signs of exhaustion after an uptrend, with bearish pressure increasing. If bulls fail to reclaim $49.00, the next leg could favor a continuation downward toward $46

Soybean Oil ShortSoybean Oil is now short on the regression break.
The roll short is +1.3% on the front month, but then flat on the following months.
There maybe a short term trader for a couple %.

SOYBEAN Oil Futures LongZL1! is now net long the regression break.
The front month roll is current +1.2% in favour of a long position.
I am considering this trade.

Oil Bitcoin3.10.25 in this video I look at a number of markets but the most notable is that oils probably ready to go lower but it's a hard trade to Short for me. a Bitcoins setting up for a reversal higher I believe, and I will explain that in the video.

Soybean Oil Futures ShortZL1! is now net short on Regression break downwards
This commodity has (+1.4%) monthly roll short.
I am considering this trade

See all ideas
Summarizing what the indicators are suggesting.
Neutral
SellBuy
Strong sellStrong buy
Strong sellSellNeutralBuyStrong buy
Neutral
SellBuy
Strong sellStrong buy
Strong sellSellNeutralBuyStrong buy
Neutral
SellBuy
Strong sellStrong buy
Strong sellSellNeutralBuyStrong buy
A representation of what an asset is worth today and what the market thinks it will be worth in the future.
Displays a symbol's price movements over previous years to identify recurring trends.
Frequently Asked Questions
The current price of Soybean Oil Futures (Jul 2028) is 49.05 USX / LBR — it has fallen −0.41% in the past 24 hours. Watch Soybean Oil Futures (Jul 2028) price in more detail on the chart.
Track more important stats on the Soybean Oil Futures (Jul 2028) chart.
The nearest expiration date for Soybean Oil Futures (Jul 2028) is Jul 14, 2028.
Traders prefer to sell futures contracts when they've already made money on the investment, but still have plenty of time left before the expiration date. Thus, many consider it a good option to sell Soybean Oil Futures (Jul 2028) before Jul 14, 2028.
Buying or selling futures contracts depends on many factors: season, underlying commodity, your own trading strategy. So mostly it's up to you, but if you look for some certain calculations to take into account, you can study technical analysis for Soybean Oil Futures (Jul 2028). Today its technical rating is sell, but remember that market conditions change all the time, so it's always crucial to do your own research. See more of Soybean Oil Futures (Jul 2028) technicals for a more comprehensive analysis.