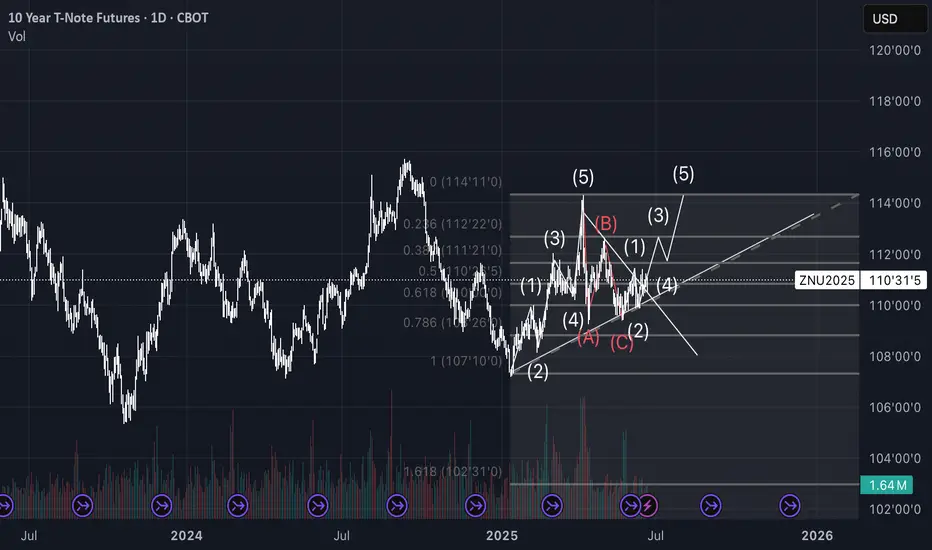
10 - Notes CallTechnical analysis of 10Y T-Note Futures (ZN1!) on 4H timeframe
Elliott Wave count with Fibonacci retracements and completed A-B-C corrective structure. Currently observing potential start of new impulsive wave (1)-(2). Breakout from descending triangle confirmed above dynamic support. Monitoring fo
Related futures
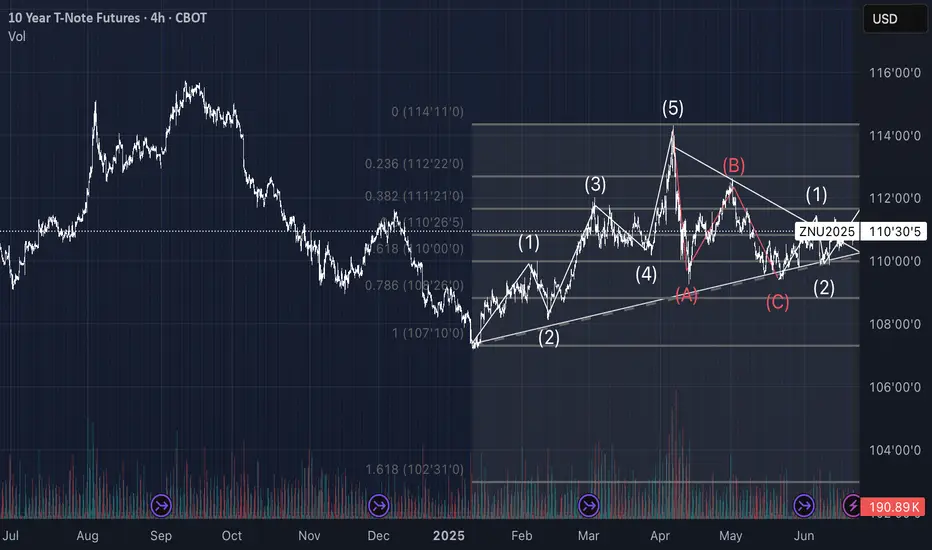
10 - NotesTechnical analysis of 10Y T-Note Futures (ZN1!) on 4H timeframe
Elliott Wave count with Fibonacci retracements and completed A-B-C corrective structure. Currently observing potential start of new impulsive wave (1)-(2). Breakout from descending triangle confirmed above dynamic support. Monitoring fo
How to Trade the Commitment of Traders Report Part 1Hey Traders so today I wanted to start a 3 part series on how to use the Commitment of Traders report to help you in your trading.
Enjoy!
Hope This Helps Your Trading 😃
Clifford

US 10 YR. T-NOTE 4 HR./ CORRECTIVE WAVE 4 IS LIKELY OVER!1). Price is very likely heading towards the fair Market value @ 107. 2). Risk Assets are Weak today on US$ strength! 3). BANKS ARE SELLING! 4). Volume is dropping. 5). Trendline is intersecting with target fib. level 50% TOWARDS 107! 6). Corrective wave 4 is likely dropping to complete wave 5. 7).

Steepening Yields & Uncertainty: What says the Bond Markets?
CBOT:ZN1!
US Yield Curve in Image Above
Showing yields on May 27, 2024 vs May 27, 2025 . What happened in a year and how to understand this?
Looking at the image above, the yield curve was inverted on this day last year. Comparing last year’s term structure to today’s, we can see t

Ten-Year Treasury Notes (ZN) Face Persistent Selling PressureThe decline in Ten-Year Treasury Notes (ZN) from the high on July 4, 2025, is unfolding as a double three Elliott Wave structure, signaling potential bearish momentum. From that peak, wave (W) completed at 109’08, followed by a corrective rally in wave (X) that topped at 112’02. The Notes have since

Bearish Outlook for 10-Year Treasury Note Futures Next WeekTargets:
- T1 = $108.75
- T2 = $107.50
Stop Levels:
- S1 = $111.20
- S2 = $112.50
**Wisdom of Professional Traders:**
This analysis synthesizes insights from thousands of professional traders and market experts, leveraging collective intelligence to identify high-probability trade setups. The wis

ZN US TREASURY PRICES BASED ON A 110 TO 134 RANGE. TIME FUNCTIONBasic Fib Framework for the ZN US Treasuries with anchores on 110 and 134 to give a range of 24 for the base reference range. 24 h = 1 day , any connection ?

Bonds Could be Forming a Big Low The drop in bonds took them down the 76 retracement level and this is where we're stalled out, at least for now.
Action in this area is consistent with a head and shoulders - and if that pattern is in play then we'd be into the rally in bonds now.
Something that's always worth noticing is when t

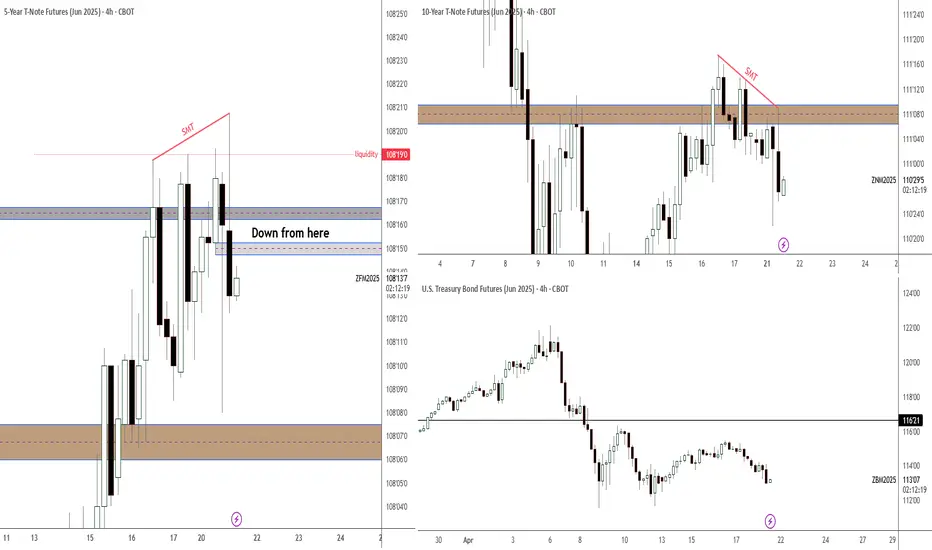
Bonds downBonds should go down according to my analysis. An as it needs more analysis to be able to publish then here you are. It will go down. SL on the SMT high.
See all ideas
Summarizing what the indicators are suggesting.
Neutral
SellBuy
Strong sellStrong buy
Strong sellSellNeutralBuyStrong buy
Neutral
SellBuy
Strong sellStrong buy
Strong sellSellNeutralBuyStrong buy
Neutral
SellBuy
Strong sellStrong buy
Strong sellSellNeutralBuyStrong buy
A representation of what an asset is worth today and what the market thinks it will be worth in the future.
Displays a symbol's price movements over previous years to identify recurring trends.
Frequently Asked Questions
The current price of 10 Year T-Note Futures is 110'31'5 USD — it has risen 0.14% in the past 24 hours. Watch 10 Year T-Note Futures price in more detail on the chart.
The volume of 10 Year T-Note Futures is 1.06 M. Track more important stats on the 10 Year T-Note Futures chart.
Open interest is the number of contracts held by traders in active positions — they're not closed or expired. For 10 Year T-Note Futures this number is 4.81 M. You can use it to track a prevailing market trend and adjust your own strategy: declining open interest for 10 Year T-Note Futures shows that traders are closing their positions, which means a weakening trend.
Buying or selling futures contracts depends on many factors: season, underlying commodity, your own trading strategy. So mostly it's up to you, but if you look for some certain calculations to take into account, you can study technical analysis for 10 Year T-Note Futures. Today its technical rating is buy, but remember that market conditions change all the time, so it's always crucial to do your own research. See more of 10 Year T-Note Futures technicals for a more comprehensive analysis.