SHORT THIS RETESTDISCLAIMER :
The content on my TRADINGVIEW profile is for informational and educational purposes only and is not and should not be construed as professional financial, investment, tax, or legal advice. Trading has large potential rewards but also large potential risk. Do not trade with money that you cannot afford to lose. The past performance of any trading idea is not indicative of future results.
ZN1! trade ideas


ZN Good entry Buy I am a consultant for anyone who needs a consultant, I see that ZN will rise in the next few minutes
NB:
1, When you decide to use my ideas in your trading, please contact me to inform you of some things and monitor the position together without specifying a take profit or stop loss, we will decide when to open and close the position
2 (When I set the take profit and stop loss in a number that does not mean that the price will reach it, I gave a buy or sell signal only according to the analyzes I made in the chart and delete it later, in the order to share it with you so that you have a clear picture and read it clearly, thank you!)


ZN1! 10Y T NOTE FUTURES (30MIN) SWINGBUY SIGNAL ( TARGET: YELLOW LINE )
The market will keep going up => touch the yellow line ( use it as a TP manually).
Probability: 65%
if the candle cut with Force the Yellow line => the market may keep going up and you can use your new TP.
No stop loss.
I will try to update this analysis if i find the time.

ZN1!It seems to me that ZN1! will increase in the next few minutes. Anyone who needs an advisor, I'm on duty.
Note:
(When I set the target and stop loss in a number that does not mean that the price will reach it, I only gave a buy or sell signal according to the analyzes that I performed in the chart and I delete it later, in order to share it with you so that you have a clear picture and you can read it in clear way
2, when you decide to use my ideas in your trading, please contact me to inform you of some things and monitor the position together without specifying the target or stop loss, we will decide when to open and close the position, thank you !!)


ZN good entry Buy I am a consultant for anyone who needs a consultant, I see that ZN will rise in the next few minutes
NB:
1, When you decide to use my ideas in your trading, please contact me to inform you of some things and monitor the position together without specifying a take profit or stop loss, we will decide when to open and close the position
2 (When I set the take profit and stop loss in a number that does not mean that the price will reach it, I gave a buy or sell signal only according to the analyzes I made in the chart and delete it later, in the order to share it with you so that you have a clear picture and read it clearly, thank you!)

ZN1! It seems to me that ZN1! will decrease in the next few minutes. Anyone who needs an advisor, I'm on duty.
Note:
(When I set the target and stop loss in a number that does not mean that the price will reach it, I only gave a buy or sell signal according to the analyzes that I performed in the chart and I delete it later, in order to share it with you so that you have a clear picture and you can read it in clear way
2, when you decide to use my ideas in your trading, please contact me to inform you of some things and monitor the position together without specifying the target or stop loss, we will decide when to open and close the position, thank you !!)

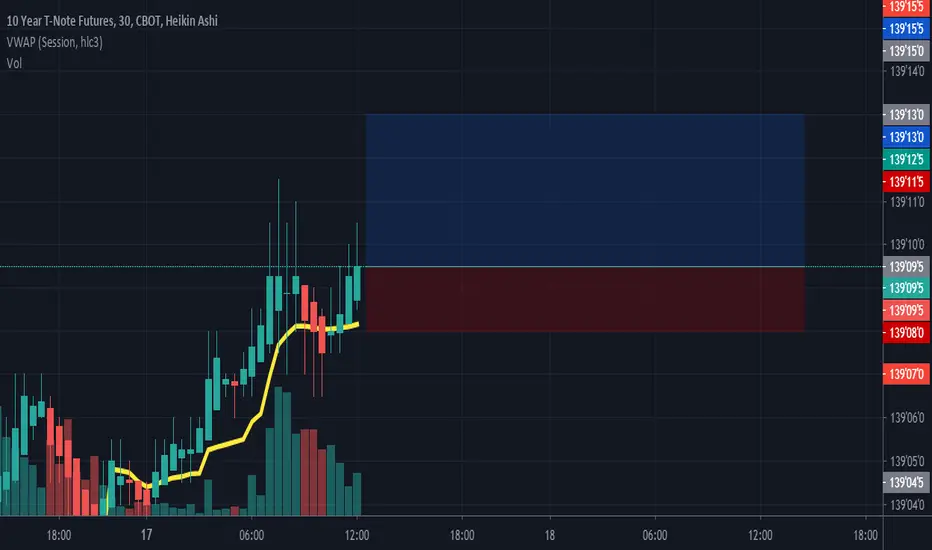
ZN1 10Y T NOTE FUTURESthe market will touch the blue line and then keep going down to the green line.
Trade 1: Buy and keep until the Blue Line: Take profit
Trade 2: Wait until you get a Tall wick above the candle ( red or Green) => Buy and use the Green line as your new TP.


Buy ZN1! Futures AT 139'17'0 19/08/2020 !!!I RECOMMENDED TO BUY 10 YEAR T-NOTE FUTURES AT 139'17'0 !!!
ZN1! 10Y T Note Futures ( 30MIN) probability: 65%
the market will keep going down and do the pull back, please Read Carefully :
The chart will keep going down and touch the Yellow Line ( You can use it as a TP manually)
If the red candle cut it with Force then you can use the Green line as Your TP at the same time ( Resistance).
If the candle Squeeze on the Yellow Line => Pull back and the market may keep going up.
If the candle squeeze on the Green Line => pull back and we considere the Yellow Line as our First TP in our uptrend.
After a Pull Back with Force the market may touch the Blue line .
I will Try to Update my prediction if i have free time.


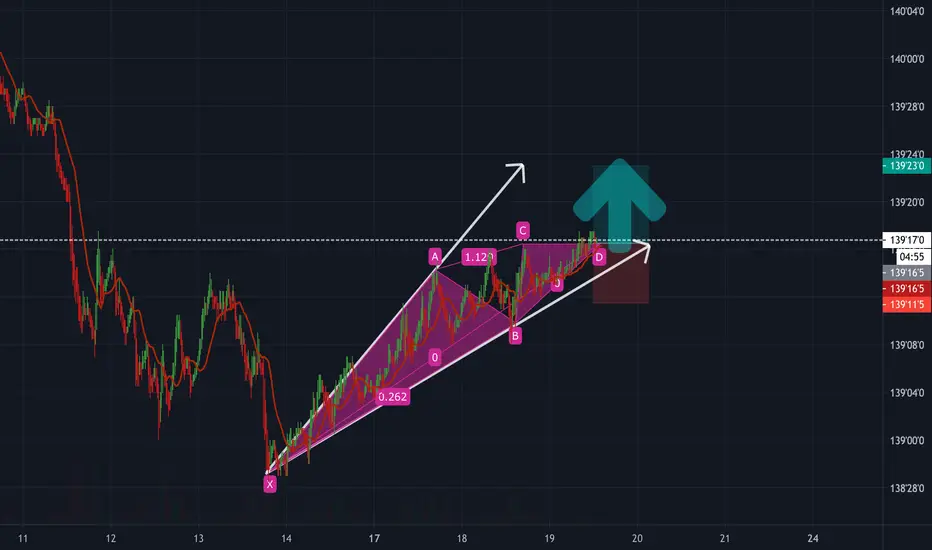
US T-Note 10Y (ZN) : Beginning of a bullish movement Buy in the blue rectangle; put the target in the green rectangle and the stop loss in the red rectangle. see you later for further analysis. Peace!

Gold, Silver, and the 10Y-NoteThis is a great visual of the correlation between these assets. One could argue the 10Y-Note emulates Gold better than Silver does.


ZN1! 10Y T Note Futures ( 30Min)Probability: 65%
The market may keep going down.
im not familiar with indicators in this plateform, so follow the instructions below.
Yellow Line: ! You can use it = Take profit
if the candle cut the line with force then u can sell and wait until the next orange line and take profit.
if the candle cut the orange line, u can choose ur new TP.


ZN1! It seems to me that ZN1! will increase in the next few minutes. Anyone who needs an advisor, I'm on duty.
Note:
(When I set the target and stop loss in a number that does not mean that the price will reach it, I only gave a buy or sell signal according to the analyzes that I performed in the chart and I delete it later, in order to share it with you so that you have a clear picture and you can read it in clear way
2, when you decide to use my ideas in your trading, please contact me to inform you of some things and monitor the position together without specifying the target or stop loss, we will decide when to open and close the position, thank you !!)