Trump kindness to the World Interest rates are set to go down quicker than we expected, as the act of kindness of President Trump is put into force
ZQM2023 trade ideas

Decoding Fed Rate Changes via Federal Funds Futures Index◉ What Are Federal Funds Futures?
● Definition: Federal Funds Futures are financial contracts traded on the Chicago Mercantile Exchange (CME) that allow market participants to bet on or hedge against future changes in the federal funds rate (the interest rate at which banks lend to each other overnight).
● Purpose: These futures reflect the market's expectations of where the Fed will set interest rates in the future.
◉ How Federal Funds Futures Work?
● Pricing: The price of a federal funds futures contract is calculated as 100 minus the expected average federal funds rate for the contract month.
➖ Example: If the futures price is 95.00, it implies an expected federal funds rate of 5.00% (100 - 95 = 5).
● Contract Expiry: Each contract represents the market's expectation of the average federal funds rate for a specific month.
◉ Why Use Federal Funds Futures?
● Predict Fed Policy: Traders and investors use these futures to gauge the likelihood of the Fed raising, cutting, or holding interest rates.
● Hedge Risk: Institutions use them to protect against potential losses caused by interest rate changes.
● Market Sentiment: They provide insight into what the broader market expects from the Fed.
◉ Steps to Analyze Fed Policy Using Federal Funds Futures
● Step 1: Check Current Federal Funds Futures Prices
Look up the prices of federal funds futures contracts for the months you're interested in. These are available on financial platforms like Bloomberg, Reuters, or the CME Group website.
● Step 2: Calculate the Implied Federal Funds Rate
Implied Federal Funds Rate = 100 - Futures Price.
➖ Example: If the futures price for March is 95.5, the implied rate is 4.5% (100 - 95.5 = 4.5).
● Step 3: Compare Implied Rates to the Current Rate
If the implied rate is higher than the current federal funds rate, the market expects the Fed to raise rates. If it's lower, the market expects a rate cut.
● Step 4: Estimate the Probability of Rate Changes
By comparing the implied rates of contracts expiring before and after an FOMC meeting, you can estimate the probability of a rate change.
➖ Example: If the implied rate for March is 4.75% and the current rate is 4.5%, the market is pricing in a 25 basis point (0.25%) hike.
● Step 5: Monitor Changes Over Time
Track how futures prices change over time. Shifts in prices indicate changes in market expectations. For example, if futures prices drop (implying higher rates), it suggests the market is anticipating a more hawkish Fed.
◉ Practical Applications
● Trading: Traders use federal funds futures to speculate on interest rate movements.
● Economic Forecasting: Economists use them to predict the Fed's monetary policy and its impact on the economy.
● Investment Strategy: Investors adjust their portfolios based on expected rate changes (e.g., shifting from bonds to equities if rates are expected to rise).
◉ Limitations of Federal Funds Futures
● Market Sentiment: Futures prices reflect market expectations, which can be influenced by sentiment and may not always accurately predict Fed actions.
● External Shocks: Unexpected events (e.g., geopolitical crisis, pandemics) can disrupt rate expectations.
● Liquidity: Less liquid contracts (further out in time) may not accurately reflect expectations.
◉ Example Analysis
Let’s assume:
➖ Current federal funds rate: 4.5%
➖ March federal funds futures price: 95.5
● Step 1: Calculate the implied rate:
100 − 95.5 = 4.5%.
● Step 2: Compare to the current rate:
The implied rate (4.5%) is equal to the current rate (4.5%), suggesting the market expects no change in rates by March.
● Step 3:
If the futures price drops to 95.25, the implied rate becomes 4.75%, indicating the market now expects a 25 basis point rate hike..
◉ Why This Matters?
● For Traders: Federal funds futures provide a direct way to bet on or hedge against interest rate changes.
● For Investors: Understanding rate expectations helps in making informed decisions about asset allocation.
● For Economists: These futures offer valuable insights into market expectations of monetary policy.
◉ Conclusion
Federal funds futures are a powerful tool for analyzing and predicting the Fed's interest rate decisions. By understanding how to interpret these futures, traders, investors, and economists can gain valuable insights into market expectations and make more informed decisions. However, it's important to consider their limitations and use them in conjunction with other economic indicators for a comprehensive analysis.
Money Market says that rate cut will be an urgent one (again)Just take a look on a rate cut expectations.
In a short, the main technical graph is a difference (spread) between the nearest futures contract on FOMC interest rate (in this time Sept'24 ZQU2024) and the next one futures contract (in this time Oct'24 ZQV2024).
It's clear that spread turned to negative in 2024, and heavily negative over the past several weeks. Historical back test analysis says that in all of such cases, FOMC is to cut interest rates immediately.
The next scheduled FOMC meeting is September17-18. Will the market wait 6 more weeks?
The right answer: NO.
Rate cut will be an urgent one (unscheduled again).

The US Election and Possible Fed Rate DetourCBOT: Micro 2-Year Yield ( CBOT_MINI:2YY1! ), Micro 10-Year Yield ( CBOT_MINI:10Y1! )
Last Thursday night, I watched the first Biden-Trump presidential debate live on TV, along with tens of millions of likely voters of the 2024 US presidential election.
Who won the debate? According to the exit poll conducted by 538/Ipsos:
• 60.1% of the likely voters being polled said former President Trump performed best;
• Only 20.8% said President Biden performed best at the debate.
However, the debate may not change the minds of many voters.
• Biden gained support from voters who would likely vote for him, from 46.7% before the debate, to 48.2% after that;
• Trump also gained support modestly, from 43.5% to 43.9%;
• Robert Kennedy, Jr., an independent presidential candidate who did not participate in the debate, saw his support increase from 17.3% to 18.4%.
What mattered most to voters?
• Inflation or increasing costs is the No. 1 issue, called out by 50% of the likely voters;
• Immigration came in 2nd at 37%, while Political polarization is the 3rd at 25%.
The second and final presidential debate is scheduled on September 10th. Ahead of this, the Republican National Convention will be held on July 15th-18th. Donald Trump is likely to be nominated as the Republican candidate for the US presidential election.
The Democratic National Convention will be held on August 19th-22nd. After his poor performance in the first presidential debate, we are uncertain if President Biden will be nominated, or replaced by an alternative candidate.
On TradingView, our focus is always on trading and investing. However, geopolitics plays a crucial role in shaping global markets, influencing economic growth, investment flows, and asset prices. Understanding the complex interplay between political events and market dynamics is essential for investors seeking to navigate the ever-changing landscape. That being said, I would like to outline these generic scenarios:
• If President Biden is re-elected for a 2nd term, he would likely maintain similar political and industry policies which we have been seeing in his first term;
• If Former President Trump returns to the White House, we would likely see huge reversal in the policies enacted by the current Administration.
What Donald Trump did in his first term will be a good indicator for what lies ahead. Looking across asset classes, I think the interest rate regime will be impacted the most in a Trump-winning scenario.
The US Interest Rate Regime
In the 21st century, we have four US presidents so far: George W. Bush (2001-2008), Barack Obama (2009-2016), Donald Trump (2017-2020) and Joe Biden (2021-2024).
The US Federal Reserve also has four Chairmen: Alan Greenspan (1987-2005), Ben Bernanke (2006-2013), Janet Yellen (2014-2017) and Jerome Powell (2018-2026).
I observe that Fed Funds Rate exhibited unique pattern under each president. Let’s look at President George W. Bush first:
• The younger President Bush came into the White House when the Internet bubble just busted, and the Enron and WorldCom scandals shook the stock markets. “9/11” occurred less than 8 months into his presidency.
• Fed Chair Alan Greenspan executed steep rate cuts to rescue the economy in crisis, pushing the Fed Fund rate down to 1% from 6.5%.
• By 2004, the economy has recovered and became overheated. To combat inflation, Chairman Greenspan hiked interest rate all the way to 5.25%.
• High interest rates busted the subprime housing market, triggering the Great Recession of 2008. New Fed Chair Ben Bernanke steered the country through the financial crisis, and lowered interest rates to 0-25 basis points.
The Obama Administration (2009-2016):
• President Obama inherited the Zero Rate environment, and throughout most of his 8-year presidency, interest rates largely stayed at the ultra-low levels.
• In the 3rd year of her Fed Chair tenure, Janet Yellen began raising interest rates, from 0-25 bps to 1.25% by the end of her four-year term.
The Trump Administration (2017-2020):
• In November 2017, President Trump nominated Jerome Powell as new Fed Chair.
• Chairman Powell continued the rate hike and raised the Fed Funds rate to 2.25%.
• President Trump openly criticized his Fed Chair and intervened central bank policy.
• Under great pressure, the Fed lowered rates in 2019. With the pandemic sending the economy into a free fall, Fed Funds rate was back to 0-25 bps by April 2020.
The Biden Administration (2021-2024):
• During the pandemic, a global supply chain bottleneck pushed US inflation to a 40-year-high at 9.1% by July 2022.
• Albeit initially assessing the inflation as transitory, the Fed launched a series of rate increases beginning March 2022, pushing the Zero Rate to 5.25-5.50% by 2023.
• While the US CPI came down to about the 3-3.5% range, the Fed was hesitant to lower rates too early. It had maintained the current rate in the last seven FOMC meetings.
As we observed from the above, Donald Trump strongly believes that high interest rates would hurt the economy. He would go out of his way and convince the Fed to lower rates. What he considered “too high” was 2.25% in 2018. The Fed Funds rate is now more than doubled at 5.25-5.50%.
In my opinion, in a Trump-winning scenario, he would call for the Fed to lower rates as soon as he returns to the White House. The Fed would cave in again, and quicken its rate cut schedule.
Trading with CBOT Micro Yield Futures
For someone who shares my view of aggressive rate-cut schedule under a new Trump Administration, he could express it by trading with CBOT Micro Yield Futures. Unlike bond futures, Micro Yield contracts quote the respective interest rates directly. A lower interest rate means lower futures prices.
Last Friday, the August contract of Micro 2Y Yield futures (2YYQ4) were settled at 4.628%. Each contract has a notional value of 1,000 index points, or $4,628 at the current price. To buy (long) or sell (short) 1 contract, a trader needs to deposit an initial margin of $330.
The August Micro 10Y Yield (10YQ4) settled at 4.318%. Notional value is 1,000 index points or $4,318. Initial margin is $320.
In my opinion, rate cuts are coming, but the timing is uncertain. At what point the presidential pressure will cause rate cuts to speed up is also uncertain.
To counter the uncertainty, a trader could use a Futures Rollover strategy. This is to maintain a Short position on Micro Yield Futures over time. When an existing contract is about to expire, we could close the position by buying the same contract, with the long order offsetting the short position. Meanwhile, the trader could enter a Short position with the newly listed contract.
Happy Trading.
Disclaimers
*Trade ideas cited above are for illustration only, as an integral part of a case study to demonstrate the fundamental concepts in risk management under the market scenarios being discussed. They shall not be construed as investment recommendations or advice. Nor are they used to promote any specific products, or services.
CME Real-time Market Data help identify trading set-ups and express my market views. If you have futures in your trading portfolio, you can check out on CME Group data plans available that suit your trading needs www.tradingview.com

🎲 Interest Rates. To Cut, or not to Cut. That is the questionJamie Dimon Sees ‘Lot of Inflationary Forces in Front of Us’, as in recent interview to Bloomberg JPMorgan CEO has warned for months that rates could stay high.
Jamie Dimon said he’s still more worried about inflation than markets appear to be.
The JPMorgan Chase & Co. chief executive officer said significant price pressures continue to influence the US economy and may mean interest rates will be higher for longer than many investors are expecting. He cited costs linked to the green economy, re-militarization, infrastructure spending, trade disputes and large fiscal deficits.
“There are a lot of inflationary forces in front of us,” Dimon said in an interview on Bloomberg Television Thursday. “The underlying inflation may not go away the way people expect it to.”
The S&P 500 and Nasdaq 100 closed at record highs Wednesday amid optimism over monetary policy easing after a measure of underlying US inflation cooled in April for the first time in six months. Dimon said that markets have been healthy for a while, but that doesn’t necessarily predict the future.
“If you have higher rates and — God forbid — stagflation, you will see stress in real estate and leveraged companies, and private credit,” Dimon said.
“Stocks are very high, and I think the chance of inflation staying high or rates going up are higher than people think,” the CEO said. “My view is whatever the world is pricing in for a soft landing, I think it’s probably half of that. I think the chances of something going wrong are higher than people think.”
The CEO has been warning for months that inflation could be stickier than many investors are predicting, and wrote in his annual letter to shareholders that his bank is prepared for interest rates ranging from 2% to 8% “or even more.”
Dimon said that “a lot of happy talk” is why markets aren’t pricing these elements in.
Even though a bigger surprise would be higher rates, Dimon said that geopolitics could create the “main stress that we’re worried about” amid the impact those dynamics have on oil and gas prices, trade and alliances. With war in Ukraine, the situation in the Middle East, tensions in North Korea and the use of nuclear blackmail, the geopolitical situation is “very tense,” he said.
When it comes to China, the right thing for America is to “fully and deeply” engage, he said. Still, the fragile relationship between the two countries makes banking in the country — where Dimon said JPMorgan has roughly 1,500 multinational clients — a riskier prospect.
“They’re not leaving China, so we’re going to serve our clients there, we’re just much more cognizant the risk is higher,” he said. “You look at China from a risk-reward basis, it used to be very good, it’s not so great any more.”
Basel III
The financial world has been in a heated debate over US proposals tied to what’s called the Basel III Endgame — an international regulatory overhaul initiated more than a decade ago in response to the financial crisis of 2008. US regulators have decided to adjust the original proposals following substantial backlash. Dimon reiterated his comments that the proposals are excessive.
“I would love to know what the end game is,” Dimon said. “Regulators should answer the question: What do you want — How do you want the system to work?”
Uncertainty pushes Gold prices (XAUUSD) more higher, later than The US Bureau of Labor Statistics on Wednesday reported the April consumer-price index rose by 0.3% from March.
Shelter, gas prices remain sticky.
Notable call-outs from the inflation print include the shelter index, which rose 5.5% on an unadjusted, annual basis, a slowdown from March. The Shelter index (the largest US CPI component with near 32% weight) rose 0.4% month over month and was the largest factor in the monthly increase in core prices, according to the BLS.
Sticky shelter inflation that was one of the main reason of 2007-09 Financial crisis is largely to blame for higher core inflation readings, according to economists.
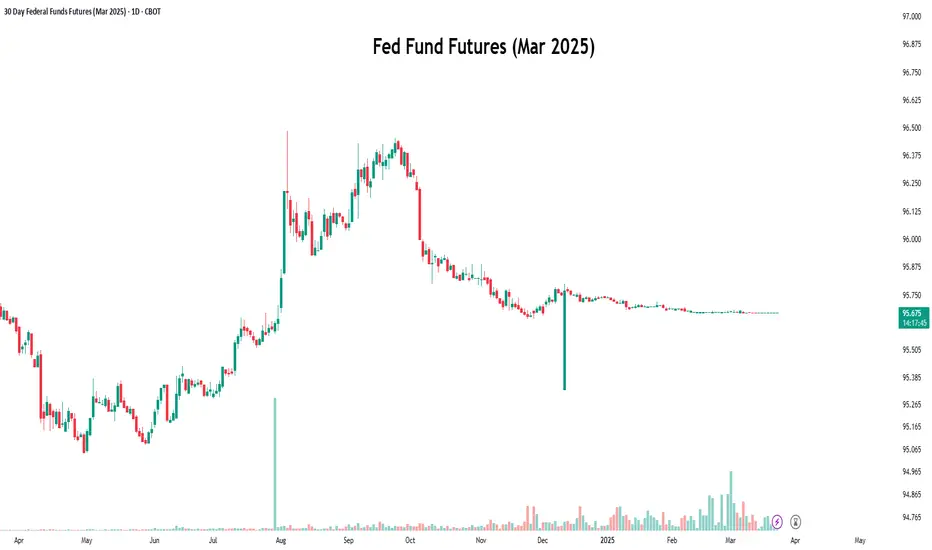
The main technical graph is an inverted (normalized) chart for expected Federal funds rate at mid-March 2025, based on respective Mar'25 FedFunds Futures Contract (ZQH2025).
Following the upside trend, as well as forming reversed Head-and-shoulders structure, the nearest target can be around 8 1/4 - 8 1/2 over the next 12 months.
Historical backtest analyses says, this scenario is not a nonsense, as in early 1980s the difference between US 10-Year T-Bond rates and US Interest rate has been already hugely negative at similar market conditions (fighting against non-stop inflation).
Let's see what is next in nowadays..

An Uncharted Landscape of Prolonged Yield Curve InversionCBOT: Micro 2-Year Yield ( CBOT_MINI:2YY1! ) and Micro 10-Year Yield ( CBOT_MINI:10Y1! )
The recent US inflation cycle started in June 2020. As the global pandemic interrupted the global supply chain, the prices of goods began to rise rapidly. In the following two years, the headline CPI shot up nearly nine percent to a 40-year high.
The Federal Reserve initially judged inflation to be transitionary and sat on the sideline for almost two years. However, when it finally came into action, it did so decisively with a campaign of aggressive interest rate increases. The hikes started in March 2022 and went on for ten more times, pushing the Fed Funds rate up 525 bps, from 0-25 bps to 5.25-5.50%.
Has the Fed tightening policy been successful? Yes and No. On the one hand, inflation rate dropped nearly 2/3 from the peak of 9.1% in June 2022 to 3.5% in March 2024. We are not yet back to the 2% policy target but are on the right track.
On the other hand, price levels remain stickily high. According to the “CPI Inflation Calculator” by the Bureau of Labor Statistics, the purchasing power of $1.22 in March 2024 equals that of $1.00 in December 2019. This means that the average price in the US has gone up 22% since the start of the pandemic. Even though the inflation rate is moving down, price levels continue to move up.
After hiking interest rates 11 times and pausing 6 times, the Fed now has a dilemma. “To cut, or Not to cut”, this is a trillion-dollar question. Adding to the complexity of the situation is that we have been in a negative yield curve environment for two years.
The Persistent Yield Curve Inversion
Yield Curve shows how interest rates on government bonds compare, notably three-month Treasury Bills, two-year and 10-year Treasury Notes, 15-year and 30-year Treasury Bonds. Bond investors expect to be paid more for locking up their money for a long stretch, so interest rates on long-term debt are higher than those on short-term. Plotted out on a chart, the various yields for bonds create an upward sloping line.
Sometimes short-term rates rise above long-term ones. That negative relationship is called yield curve inversion. An inversion has preceded every U.S. recession for the past half century, so it’s seen as a leading indicator of economic downturn.
The chart above shows a downward slopping Treasury yield curve on May 12th. We observe that 3MO Bill currently yields 5.391%, while the 10Y Note yields just 4.5%, which is 89 bps lower.
Financial markets use the yield spread of 10Y and 2Y Notes as a benchmark for yield curve relationship. In a normal interest rate environment, the 10-2 yield spread is a positive number. On July 21st, 2022, 2Y yield stood at 3.00%, above the 2.91% on 10Y yield. This was the first time in ten years that the 10-2 spread turned negative (-9 bps).
Almost two years later, the yield curve inversion remains in effect. On May 12th, the 10Y yield, the 2Y yield, and the 10-2 spread are 4.50%, 4.87% and -37 bps, respectively.
Under an unprecedented period of negative yield curve, how the shifting of Fed policy would impact interest cost of long- and short-duration remains to be seen.
Trading with CBOT Micro Yield Futures
The complexity of yield curve inversion makes analyzing interest rates extremely difficult. We could narrow down the analysis on the two key points of the yield curve, the 2Y and the 10Y. The underlying Treasury bonds are among the most liquid financial instruments in the world. The 10-2 spread trades are also very popular for interest rate investors.
We could simplify our analysis into the following:
• To formulate a viewpoint on the future direction of the 2Y yield;
• To formulate a viewpoint on the future direction of the 10Y yield;
• To formulate a viewpoint on whether the 10-2 spread will be widened or tightened.
From a trading perspective, if you have confidence in any one of the three, you could develop a trading strategy by using CBOT Micro Treasury Yield Futures.
Last Friday, the June contract of Micro 2Y Yield futures (2YYM4) were settled at 4.722%. Each contract has a notional value of 1,000 index points, or $4,722 at current price. To buy (long) or sell (short) 1 contract, a trader is required to deposit an initial margin of $340.
The June Micro 10Y Yield (10YM4) was settled at 4.489%. Notional value is 1,000 index points or $4,489. Initial margin is $320.
The 10Y-2YY yield spread for June contract is -23.3 bps (= 4.489 - 4.722). A long (short) spread trade involves buying (selling) one 10Y futures and shorting (buying) one 2YY futures simultaneously. It requires an initial margin of $660 (= 340 + 320).
My thought below is for your information only. First, on the 2YY:
• You could decompose the 2Y yield into 24 consecutive 1M rates over a 2-year period. The negative 37 bps between the Fed Funds rate and 2Y yield may be considered the weighted average of these 1M rates, with the expectations of Fed cutting rates.
• The Fed is unlikely to raise rates again. But it remains highly uncertain when it will start cutting rates and how often it will do.
• Consequently, the 2YY could fluctuate in the short-term, but would decline over time.
• To express this view, a short 2YY futures rollover strategy may be appropriate.
• My last idea on May 6th includes a detailed explanation on futures rollover strategy. Let’s recap the long futures rollover here:
o In April, buy (going long) a June contract.
o In June, short the June contract to close the existing position. Buy an August contract and reestablish a long position.
o The trader would repeat the above steps, so far as he holds a bullish view.
o A short futures rollover will be the exact opposite of the above.
My thought on the 10Y:
• The Fed rate hikes had a lagging effect on longer term rates. While mortgage rate, auto financing, business loan and credit card rate have all risen substantially, 10Y yield is still priced at 1 full percentage point below the Fed Funds rate. Due to the cumulative effect of past interest rate hikes, mortgage rates and auto loan rates are still rising, even though the Fed has paused.
• Would the Fed rate cuts, applied on the overnight rate only, bring down the long-term interest rates? In my view, it takes a series of cuts to reverse the negative yield curve. In a presidential election year, the Fed is unlikely to make abrupt policy shifts.
• The uncertainty with long-term yield makes it risky to do an outright directional trade.
My thought on the 10Y-2Y spread:
• We have been in a negative yield environment for nearly two years, without having experienced an economic recession. This is an uncharted territory.
• In my opinion, the US economy is very resilient. Growth may be slowed, but a recession is unlikely. Massive government deficit spending would continue to pour money into the system, supporting business growth, full employment and robust consumer spending.
• The 2Y yield is affected directly by the Fed. It would decline in the next two years due to the expected Fed rate cuts.
• The 10Y yield is both impacted by the Fed actions and the market demand for long-term debt. It has been rising while the Fed kept the rates unchanged. Future rate cuts would slow the rise but may not be sufficient to push it downward.
• On balance, 2YY would likely fall faster than 10Y. Mathematically, it would translate into a wider 10Y-2YY spread.
• To express this view, a long 10Y-2YY spread trade may be appropriate.
Happy Trading.
Disclaimers
*Trade ideas cited above are for illustration only, as an integral part of a case study to demonstrate the fundamental concepts in risk management under the market scenarios being discussed. They shall not be construed as investment recommendations or advice. Nor are they used to promote any specific products, or services.
CME Real-time Market Data help identify trading set-ups and express my market views. If you have futures in your trading portfolio, you can check out on CME Group data plans available that suit your trading needs www.tradingview.com

Repricing Interest Rate Cuts! We return to Fed Fund Futures, as the market has been repricing interest rate cut expectations. At the beginning of the year, there were 150bps of cuts expected by the market on the premise of a weaker economy, falling inflation, and a softer labor market. However, none of these expectations have materialized. The market has settled into a middle ground ahead of the Fed’s interest rate projections next week.
What comes next?
As we can see, the front and deferred month (December) Fed Fund Futures currently reflect a price of -0.635, equivalent to 63 ½ basis points, indicating that the market is currently pricing in 63 ½ basis points worth of cuts. This is very interesting, as the market is currently pricing in "fewer cuts" than what the Fed guided in its previous interest rate projections.
It is important to highlight that the current Fed only cuts or raises in increments of 25 basis points, so we can see a near-perfect balance between 75 basis points and 50 basis points (62 ½ would be the midpoint). This indicates that the bond market lacks confidence that the Fed will maintain 75 basis points worth of cuts in 2024.
Technical Analysis:
When observing momentum of the chart, along with the strength of the labor market, and hotter-than-expected inflation numbers, it seems we are headed toward a potential Fed projection of 50 basis points worth of cuts in 2024.
Check out CME Group real-time data plans available on TradingView here: www.tradingview.com
Disclaimers:
CME Real-time Market Data help identify trading set-ups and express my market views. If you have futures in your trading portfolio, you can check out on CME Group data plans available that suit your trading needs www.tradingview.com
*Trade ideas cited above are for illustration only, as an integral part of a case study to demonstrate the fundamental concepts in risk management under the market scenarios being discussed. They shall not be construed as investment recommendations or advice. Nor are they used to promote any specific products, or services.
Futures trading involves substantial risk of loss and may not be suitable for all investors. Trading advice is based on information taken from trade and statistical services and other sources Blue Line Futures, LLC believes are reliable. We do not guarantee that such information is accurate or complete and it should not be relied upon as such. Trading advice reflects our good faith judgment at a specific time and is subject to change without notice. There is no guarantee that the advice we give will result in profitable trades. All trading decisions will be made by the account holder. Past performance is not necessarily indicative of future results.

The Final Piece Of The Pre-FOMC Data JigsawAfter a disappointing labour market report last week, where a blowout nonfarm payrolls print was overshadowed by rather dismal details in the household survey, focus now turns to the February US CPI report, being the last significant piece of the data jigsaw before the March FOMC meeting.
Off the back of hotter than expected inflation figures in January, with price pressures in the services sector remaining particularly stubborn, consensus sees headline CPI remaining unchanged at 3.1% YoY in February, though the core measure should cool 0.2pp, to 3.7% YoY. On an MoM basis, headline CPI is seen quickening to 0.4%, from 0.3%, while the opposite is true of the core figure, set to cool to 0.3% MoM from the 0.4% pace notched in January.
Clearly, while data in line with consensus would again point to inflation remaining more elevated than most would desire, particularly those on the FOMC, such a report would at least point to the fact that underlying inflationary trends don’t appear to be strengthening. While this may seem like ‘clutching at straws’, it’s important to recognise that policymakers are not overly focused on a single month of data, instead paying much closer attention to the trend that inflation is taking over a period of time.
On this note, it is the 3- and 6-month annualised rates of core CPI that are likely to be the most closely watched areas of the report. This is especially true given the pickup in the former gauge to 4% last month, its highest level since last June, implying that it may still be some time before the FOMC have the “confidence” in a return to the 2% inflation target that they are seeking before delivering the first rate cut.
In terms of the details of the inflation report, the data will likely again flag deflation in goods, with the core services category still providing the most significant inflationary impulse, and being the main hurdle to achieving a further easing in price pressures.
There are, however, some quirks with the data here, particularly in terms of shelter, with the ‘Owners Equivalent Rent’ (OER) measure accounting for around a third of the core CPI figure. Without digging into the weeds too much, the surge in OER in the January report, primarily due to the BLS re-weighting their sample for calculating the measure, played a significant role in the substantial upside surprise in the core CPI metric. With single-family detached homes now having a higher weight in the OER index, and rent inflation here outpacing that of other housing categories, OER is likely to remain elevated for some time, somewhat underpinning the core CPI metric.
Furthermore, this will likely lead to a continued divergence between the more widely-watched CPI figures, and the Fed’s preferred PCE inflation gauge. OER comprises only around 15% of the core PCE figure, less than half its weight in the core CPI metric, thus raising the risk of drawing false conclusions on the policy outlook by looking at the consumer price index alone.
In any case, data quirks or not, the February CPI report is likely to be a significant vol event for financial markets, particularly with it representing the final top-tier data point due before the March FOMC decision. Incidentally, with us now being just over a week from that meeting, the Fed are now in the pre-meeting ‘blackout’ period, meaning there will be no comments from policymakers in the aftermath of the inflation figures, somewhat leaving investors ‘flying blind’ as to how the Committee may interpret the data when they meet for their next confab.
As a somewhat rough form guide, we can examine how markets have reacted to CPI prints in recent months, of course remembering the key caveat that past performance is no guarantee of future results.
Over the last year, the S&P 500 has ended the day in negative territory on just four occasions on ‘CPI Day’, with the average move in the benchmark index standing at +/-0.8% over the last six months on the day of the inflation release, the highest said average has stood at since April.
Condensing the timeframe further, the front S&P 500 future has fallen in the 30 minutes, and the hour, following the CPI release on the last 3 occasions, with an average decline of 0.6% and 0.5% over each period, respectively. It must be said, however, that the last 2 headline YoY CPI figures did surprise 0.2pp above consensus expectations, perhaps skewing this study somewhat.
Unsurprisingly, the opposite of the above study is true if one looks at the performance of the dollar, using the DXY as a relatively rudimentary proxy. The greenback has gained ground in the hour following the CPI print on 4 of the last 5 occasions, with each of these 4 rallies following a hotter-than-expected inflation figure.
It seems logical to expect that playbook to again hold true this time around, with cooler-than-expected data likely to spark a dovish reaction (risk bid, Treasuries rally, USD sold), and hotter-than-expected figures likely to ignite a hawkish one (USD bid, risk sold, Treasuries offered). As alluded to, the core MoM print is likely the most significant in terms of prompting a short-term market reaction
Any dovish reaction, though, is unlikely to see markets bring forward pricing of the first 25bp Fed cut to May, from June, with one positive inflation surprise likely being far from enough to provide the FOMC with the “confidence” needed that inflation is on its way back to the 2% target.
In fact, from a policy point of view, one inflation report – no matter if hot or cold – is unlikely to dramatically alter the thinking of most policymakers on the FOMC, with rate cuts this year still overwhelmingly likely. What a trend of hotter-than-anticipated data may trigger, however, is a reassessment of how many cuts will be delivered this year, and when they may begin.
On this note, a hot report will substantially raise the probability of the median 2024 dot, in the FOMC’s March SEP, pointing to 50bp of easing this year, compared to the present 75bp median; it will only take two policymakers moving their ‘dot’ higher to shift the median to that extent, with that possibly being the biggest risk for equities at this juncture.

Macro Trader: Swaps = DotsWell, what a turnaround it’s been. Just 57 days ago, markets were flat-out ignoring what the FOMC were saying on the policy outlook, and pricing as many as six 25bp rate cuts over the course of the year ahead. Now, less than two months later, the swaps are in line with the dots, as we see money markets implying just 75bp of easing this year, with the first 25bp cut not fully priced until July. Naturally, this begs the question of how we got here, and what comes next.
It must be said that the hawkish repricing which markets have undergone has not been a straightforward journey. Nevertheless, the labour market remaining incredibly tight, including the blowout +353k jobs which were added in January, in addition to the bumpier than expected disinflation path, to which recent hotter-than-expected CPI and PPI data have nodded, have combined to see market participants ‘wake up and smell the coffee’ that the easing cycle will neither be coming as soon, or turn out to be as aggressive, as had previously been expected.
Unsurprisingly, the hawkish repricing has not been spurred by some sort of collective epiphany among investors that we should suddenly be taking the FOMC’s word on the policy outlook as gospel. If anything, the January FOMC meeting has arguably been the only real ‘dovish’ event of the year, with the Committee having dropped their explicit tightening at that meeting, despite flagging the need for more ‘confidence’ of inflation returning to the 2% target before firing the starting gun on the easing cycle.
This seems more a case of data forcing the market to view the economy, and by extension the likely rate path, through a different lens – i.e., one that points to much more resilience, and somewhat stickier prices (especially in services) than previously expected – rather than the FOMC explicitly steering the market’s opinion.
However we got here, the most important thing is that the curve, and the dot plot, are now bang in line with each other. Now we’re here, where do we go next?
Though you should never answer a question with another question, I am going to do so. What market participants should really be asking here is whether Mr Market is now prepared to go further, and price a more hawkish outlook than policymakers have outlined? And, what catalysts would be required for it to do so?
Naturally, one’s mind turns to both inflation, and the labour market, to answer those queries. Handily, we have our latest read on the Fed’s preferred inflation gauge – the core PCE deflator – later this week, with risks to the 2.8% YoY and 0.4% MoM consensus estimates likely tilted to the upside after the aforementioned hot CPI and PPI prints earlier in the month. It is important to note, though, that the calculations for each index, and the basket weights for items included in each, do have some significant variations, particularly when it comes to rent inflation.
In any case, we would likely need to see a significantly hotter-than-expected PCE print to substantially move the needle in a more hawkish direction, particularly with an upside surprise likely already discounted, at least to some extent.
We turn, then, to the labour market, and the next jobs report on 8 March. While it is rather too early at this stage for forecasts for the print to have been modelled and published, it seems likely that payrolls growth will moderate from the >300k pace seen in each of the prior two months. Though, given recent form, one would be wise not to bet against the continuing strength of the US labour market. Once again, we would likely need a materially hotter-than-expected print, probably in line with the January report (+353k NFP with 3.7% or below unemployment and sizzling hot 0.6% MoM average hourly earnings growth) to spark a significant and sustained hawkish repricing.
Taking those two key event risks into account, and also considering that OIS pricing works as a probability distribution, hence some ‘insurance’ will likely remain priced in case of an aggressive easing cycle by virtue of a financial accident, or sharper than expected growth slowdown, it seems that the bar for a further hawkish repricing is a relatively high one.
Some, therefore, are likely to be starting to mull whether now may well be an appropriate time to fade some of the selling that has recently been seen in the fixed income complex, particularly at the front end of the Treasury curve, at least until the next FOMC (and dot plot) on 20th March. I put such a short time limit on that position as it would only take two FOMC members to upwardly revise their end-2024 rate expectation 25bp higher, for the median dot to make an equivalent move higher to 4.875% - putting us back, at least some of the way, to ‘square one’.
Of course, were such a rally – even if short-term – to occur in Treasuries, that begs the question of where the dollar, and risk more broadly, may head.
For the greenback, while one may logically expect lower front-end yields to see headwinds intensify, there are two easily-identifiable issues with this view.
The first is that, as I’ve discussed at some length recently, there is little else in the G10 FX universe that appears particularly attractive to be long of at this moment in time. The BoJ continue to disappoint those expecting a more rapid tightening cycle, the EUR is rather unattractive owing to continued anaemic economic growth, the AUD and the NZD look likely to continue facing headwinds due to the ailing Chinese economy, while the GBP remains at risk from the lagged effects of the BoE’s tightening campaign and subsequent wave of mortgage refinancing, even if recent PMI surveys have pointed to activity beginning to pick up.
Secondly, there is the question not of the short-term rate outlook, but of what happens in the easing cycle as a whole. Given the aforementioned sticky price pressures, particularly in the services space, there remains the residual risk that this will be a late-90s-esque ‘short and shallow’ cycle, rather than the prolonged loosening back towards neutral that markets currently price. This should help to underpin a certain level of demand for the greenback in the medium-term.
As for equities, at the risk of sounding flippant, I would humbly suggest whether any of this actually matters.
I’m not sure that many would’ve believed me if, at the start of the year, I’d outlined a scenario where markets would price out over 80bp of Fed cuts, the 2-year yield would rise almost 50bp, and that – despite that – both the S&P 500 and Nasdaq 100 would rally to fresh record highs, and print such all-time highs on a near daily basis.
However, that is exactly what has happened, with equities having become detached from near-term rate expectations, instead focusing on something that I continue to harp on about. That being that central banks now have the flexibility, with inflation well on its way back to 2%, to deliver whatever form of easing cycle they deem necessary, at a pace of their liking, while also dispatching any necessary targeted liquidity injections to resolve issues that may occur in certain corners of the market.
It is this optionality, and the flexible Fed put that results from it, which means that the policy backdrop remains incredibly supportive, with said backdrop likely to make playing risk from the short side on anything other than the shortest of timeframes difficult for some time to come.

How Many Interest Rate Cuts in 2024?In January 2024, the market had priced in more than 150 basis points worth of interest rate cuts. This suggested six 25-basis-point cuts throughout the year. Market participants believed that economic weakness was on the horizon, thus pricing in more cuts than the Fed’s Summary of Economic Projections (SEP).
Why the Change?
The continued strength of the labor market has fueled consumer spending and confidence. Energy prices have remained in focus, and natural gas prices have fallen by more than -30% year-to-date. Some may even say that inflation is reaccelerating as CPI and PPI numbers for the month of January came in hot. This has driven the bond market to slash interest rate cut expectations, putting pressure on some risk assets, but not all.
What is the Bond Market Pricing now?
As we can see from the chart above, Fed Funds futures are now pricing in 75 basis points worth of cuts in 2024, with a 73% chance of that first cut taking place in June and a 90% chance of the first cut taking place in July. The interesting thing to note here is that the bond market is now pricing in the same amount of interest rate cuts as the FOMC's latest Summary of Economic Projections (SEP). In other words, the two expectations have now converged.
Check out CME Group real-time data plans available on TradingView here: www.tradingview.com
Disclaimers:
CME Real-time Market Data help identify trading set-ups and express my market views. If you have futures in your trading portfolio, you can check out on CME Group data plans available that suit your trading needs www.tradingview.com
*Trade ideas cited above are for illustration only, as an integral part of a case study to demonstrate the fundamental concepts in risk management under the market scenarios being discussed. They shall not be construed as investment recommendations or advice. Nor are they used to promote any specific products, or services.
Futures trading involves substantial risk of loss and may not be suitable for all investors. Trading advice is based on information taken from trade and statistical services and other sources Blue Line Futures, LLC believes are reliable. We do not guarantee that such information is accurate or complete and it should not be relied upon as such. Trading advice reflects our good faith judgment at a specific time and is subject to change without notice. There is no guarantee that the advice we give will result in profitable trades. All trading decisions will be made by the account holder. Past performance is not necessarily indicative of future results.

The Summer Of Rate CutsLondon is cold, wet, and grey at present – rather typical of your average British winter. I hope, then, that you’ll forgive me for looking ahead to the brighter summer months, particularly as financial markets are beginning to do the same.
Even after a hotter-than-expected January US CPI report, money markets continue to price a ‘summer of rate cuts’. Though the, somewhat futile, game of guessing, and second-guessing, when central banks will kickstart easing cycles, and how deep these cycles will be, continues on a daily basis, consensus is rapidly forming around a single view – that most DM central banks will deliver the first 25bp cut somewhere between June and September, and that cuts will probably continue until around the middle of next year.
I think there are a number of important things to note regarding this.
Firstly, we should consider what may force a rate cut sooner than the halfway mark of the year. For most, particularly the FOMC, such a catalyst would most likely have to be some kind of financial accident – regional banks becoming an issue once more, CRE strains making themselves more known, or a ‘black swan’ that we cannot as yet foresee. In any case, this leads to the logical conclusion that if a cut were to come before June, it would likely be one much greater than your ‘common or garden’ 25bp rate reduction, as any such financial stability issues would be near-certain to result in much more forceful policy action.
I would set both the ECB, and the SNB, aside from this view, however, owing to rapid disinflation being seen in both economies, with Swiss inflation now in the low-1%s, and as the eurozone economy continues to rapidly lose momentum. April, and March, respectively, seem the most likely timelines for cuts from each.
Secondly, is the synchronised nature of the easing cycle that markets price. Just as G10 central banks rapidly raised rates in line with each other in 2022-23 to stamp down on what had been misleadingly labelled ‘transitory’ inflation, policy rates are seen falling at a similarly synchronised pace. While there will, naturally, and as touched on, be some minor variation in timing and magnitude, the base case is that most G10 central banks will ease somewhere around 100bp this year, with a similar degree of easing likely the following year, taking rates – roughly – back to a more neutral setting, particularly if, and when, inflation returns back to the 2% target.
This synchronicity, coupled with the increased liquidity that policy loosening will provide, should help to keep something of a lid on volatility, particularly in the equity, and fixed income space, as we approach election season in the US, and likely the UK, later in the year. Furthermore, the end of quantitative tightening, perhaps an underdiscussed topic at this stage, will likely provide a further fillip to global equities, though US outperformance seems set to continue.
Such a synchronised easing cycle does beg the question, however, of whether some – or even, most – DM central banks are now simply in a waiting game, wanting the Fed to be the first to cut, before kicking-off their own easing cycles. As noted, some, like the ECB and SNB, are unlikely to be able to play such a waiting game, though others, such as the BoE and RBA, will likely hold out as long as possible, as inflation proves somewhat stickier. Of course, the BoJ remain an outlier here, though the 10-20bp of tightening that Japan seems likely to deliver this year seems unlikely to significantly move the needle.
Hence, while this relatively co-ordinated easing cycle is likely to dampen vol more broadly, tradeable themes are likely to be relatively plentiful in the G10 FX space. A broad-based long USD as the ‘exceptionalism’ narrative shows little sign of slowing feels just, with long USD/CHF and short EUR/USD two particularly attractive options given the aforementioned idiosyncratic factors impacting both economies, while the GBP may – at long last – outperform if, indeed, the ‘Old Lady’ does maintain Bank Rate at 5.25% for longer than peers, as seems likely given continued sticky services inflation.
Nevertheless, the broader framing of this entire policy easing debate must be that the defining feature of almost all central bank rhetoric over the last few months has been aimed at engineering as much of one thing as possible – flexibility. All the talk of data-dependence, seeking more ‘confidence’ of inflation’s return to target, and refusing to give any calendar-based guidance as to the timing of cuts, has been a deliberate effort from policymakers to give themselves as much optionality as possible.
In short, central banks can now reasonably cut whenever they desire, and whenever they need to. While markets price a consensus that should result in relatively low volatility, and a relatively gradual cycle of policy loosening, if the last few years have taught us anything, it should be that markets rarely follow such a linear path.
That central banks can, at any point, unleash a liquidity bazooka dependent on prevailing economic and financial conditions, should provide the necessary reassurance to keep a lid on vol, and to keep the medium-run path of least resistance leading higher for risk-sensitive assets.

Fed Funds Futures - Repricing Economic Resilience?Recent price action in the CME's 30-day Fed Funds Futures has ruled out one cut for 2024. As of the end of 2023, the spread between the front-month Fed Funds Futures and the deferred (December) ones indicated a 150-155 basis points spread, suggesting that the markets were anticipating six cuts in 2024. However, recent developments have prompted a reevaluation, making market participants rethink the likelihood of six cuts.
Economic Developments:
On January 4, ADP NonFarm data reported an addition of 164,000 private jobs, surpassing estimates of 115,000. Initial and Continuing claims for the first week of January also demonstrated strength. The question arises: If the labor market remains tight and inflation is returning to the 2% target, does the Fed need to implement six cuts?
What’s Next?
The market will continue to be data-dependent, mirroring the Fed's approach. This Friday's job data will provide clarity on the labor market, which will include Average Hourly Earnings, Unemployment Rate, and NonFarm payrolls. These factors will play a pivotal role in shaping the market's perception of the interest rate landscape.
The recent price action in equity markets have experienced a sell-off, with one cut taken off the table. The question remains: Will equity markets continue to react strongly to the possibility of a single 25 basis point cut? Or will the bond market begin to take more interest rate cuts off of the table?
Check out CME Group real-time data plans available on TradingView here: www.tradingview.com
Disclaimers:
CME Real-time Market Data help identify trading set-ups and express my market views. If you have futures in your trading portfolio, you can check out on CME Group data plans available that suit your trading needs www.tradingview.com
*Trade ideas cited above are for illustration only, as an integral part of a case study to demonstrate the fundamental concepts in risk management under the market scenarios being discussed. They shall not be construed as investment recommendations or advice. Nor are they used to promote any specific products, or services.
Futures trading involves substantial risk of loss and may not be suitable for all investors. Trading advice is based on information taken from trade and statistical services and other sources Blue Line Futures, LLC believes are reliable. We do not guarantee that such information is accurate or complete and it should not be relied upon as such. Trading advice reflects our good faith judgment at a specific time and is subject to change without notice. There is no guarantee that the advice we give will result in profitable trades. All trading decisions will be made by the account holder. Past performance is not necessarily indicative of future results.

Prepare for a Hard Landing!January-2025 Fed Funds Futures (FFF) contract is one of the indicators that reflects the big increase in the soft landing scenario as the market is beginning to expect rates to fall.

Fed Pause is the New Restricted PolicyCME: Micro Russell 2000 ( CME_MINI:M2K1! )
Global financial market orbits around Federal Reserve’s interest rate decisions. By concept, hiking interest rates means monetary tightening while cutting them signals easing. In reality, market perception to the Fed actions evolves over time, sometimes blurring the difference between “good news” and “bad news”.
• On May 5, 2022, the Fed surprised the market with a larger-than-expected 50-bps rate hike. The S&P 500 fell 3.6%. This is a normal market reaction to bad news.
• On July 27, 2022, the Fed hiked 75 bps and the S&P soared 2.6%! Previous meetings saw the Fed raising the stake from 25 to 50 and then 75 bps. By not getting a bigger 100-bp hike, investors were relieved and cheered as if it were good news.
• On February 1st, the Fed raised for the 8th time, but the S&P went up 1%. With lower-than expected inflation, investors concluded that this would be “the last” rate hike.
• On September 20th, the Fed paused after raising for 11 consecutive times. The S&P were down 1% as investors were spooked by the hawkish Fed statement.
Last Friday, the Bureau of Economic Analysis (BEA) reported that personal consumption expenditures price index (PIC) excluding food and energy increased 0.1% for August, lower than expectation. On a 12-month basis, the index was up 3.9%.
As the Fed’s favorite inflation gauge shows that the fight against higher prices is making progress, “Fed Pause” might be the new baseline case for the US central bank’s interest rate decision.
The futures market agrees. CME FedWatch Tool shows that the probability of the Fed keeping rate at 5.25-5.50% is high through Mid-2024. Specifically:
(Link: www.cmegroup.com)
• Fed pause on November 1st, 2023 FOMC meeting: an 82% probability
• Fed pause on December 13th, 2023: at 65%
• Fed pause on January 31st, 2024: at 65%
• Fed pause on March 20th, 2024: at 60%
• Fed pause on May 1st, 2024: at 49%
Last year, a Fed Pause meant slowing the rate hikes. It has a very different meaning now: to keep the interest rate higher for longer. Therefore, what was once a signal of easing should now be viewed as restricted monetary policy.
Even if the Fed stops raising rates, the cumulative effect of past rate hikes would continue to ripple through the US economy. Government policy has a lagging period, but it has passed. Households and businesses now feel the full force of higher borrowing costs. Below are two-year changes of selected interest rates from the FRED:
• 30-Year-Fixed Mortgage Rate: from 3.01% to 6.29% to 7.29%
• 72-Month New Car Loan: 4.17% - 5.19% - 7.80%
• Credit Card Interest Rate: 14.61% - 15.13% - 20.68%
• Baa Corporate Bond Yields: 3.26% - 5.97% - 6.39%
Restricted monetary policy would have negative impacts on stocks. Good news: Market prices show that investors have not yet adapted to changes in the Fed trajectory.
Russell 2000: The Weakest Link
The discounted cash flow (DCF) pricing theory states that stock price is the present value (PV) of expected future cash flows discounted by the weighted average cost of capital (WACC). A higher cost of capital shall cause stock price to fall, other things equal.
Small- and medium-sized companies would be hit harder comparing to larger corporations. As rates go up, credit standard will be tightened, and credit spread will expand. Below are current bond rates charged to companies with different credit scores:
• 10-Year Treasury Bond Yield: 4.58%
• Moody’s Aaa Corporate Bond Yield: 4.95%
• Moody’s Baa Corporate Bond Yield: 6.39%
• Bank of America BBB Corporate Bond Yield: 6.31%
• Bank of America BB High Yield: 7.55%
• Bank of America CCC or Lower High Yield: 14.05%
Russell 2000 is the benchmark stock market index for the US small companies. CME Micro Russell 2000 futures ( FWB:M2K ) has a drawdown of 200 points in the past two months, from yearly high of 2013 to 1807. The index is still up 2.6% YTD.
As the Fed keeps rates high for the next 6-9 months, corporate bond yields could likely go higher. And the credit spreads, including Baa-Bbb, Baa-Bb, and Baa-Ccc, would likely get wider. This could put further downward pressure on the Russell index.
Could we quantify the impact? Let’s illustrate this with a $1 million payment, to be received in five years.
• Applying the BBB corporate bond yield 6.31% as the WACC, present value of $1 million will be $736,427.
• If the WACC goes up by 200 bps, the PV will be reduced to $670,899.
• This shows that a 2% increase in WACC could cause an 8.9% loss in market value.
The same concept would work on the Russell index. WACC could go up, either due to a rise of general interest rate level, or because of the widening of credit spread. The result would be the decrease in the market value of Russell component companies.
For someone with a bearish view of the Russell 2000, he could establish a short position in Micro Russell futures. The contract has a notional value at $5 times the index. At Friday closing price of 1807, each December contract (M2KZ3) is worth $9,035. CME Group requires an initial margin of $620 for each M2K contract, long or short.
A short trader would gain $5 for each point the M2K moving down. Hypothetically, if the Russell is 5% lower, the 90-point slide would translate into $452 gain per contract. The risk of short futures is the index going up. If investors continue to perceive Fed Pause as “good news”, Russell could rise after the November and December FOMC meetings.
Happy Trading.
Disclaimers
*Trade ideas cited above are for illustration only, as an integral part of a case study to demonstrate the fundamental concepts in risk management under the market scenarios being discussed. They shall not be construed as investment recommendations or advice. Nor are they used to promote any specific products, or services.
CME Real-time Market Data help identify trading set-ups and express my market views. If you have futures in your trading portfolio, you can check out on CME Group data plans available that suit your trading needs www.tradingview.com

Cracking the Fed Rate-Setting CodeCME: Micro Russell 2000 ( CME_MINI:M2K1! )
On August 25th, Federal Reserve Chair Jerome Powell delivered his annual policy remark, “Inflation: Progress and the Path Ahead”, at the Jackson Hole Symposium.
The message is very clear: It is the Fed's job to bring inflation down to the 2% policy goal. The Fed is prepared to raise rates further if appropriate and intends to hold policy at a restrictive level until inflation is moving sustainably down toward its objective.
In my opinion, there is a constraint when the Fed considers its policy choices. If monetary tightening pushes the US economy into a recession, it will likely pause or pivot. The Fed aims to cool the economy, not to put the flame out.
The Fed Chair maintains that he iterates his decision at each FOMC meeting based on latest available data. I liken this process to a “For Loop” and an “If Statement” in computer programming. Below is my pseudo code in human readable form:
• for (i = 0; i < n; n++), where n is the number of FOMC meetings;
• if (inflation goes down to 2%), then execute “End Rate Hikes”;
• else if (the US economy tanks), also execute “End Rate Hikes”;
• else, execute “Continue with Restrictive Monetary Policy”);
In other words, the only two conditions that could trigger the end of rate hikes are:
• Rate hikes successfully bring the inflation down to 2%; or
• Rate hikes break the US economy.
To crack the code of the Fed rate-setting decisions, we need to gain some understanding of the US inflation trajectory and the economic growth potential.
Inflation Outlook: Coming Down but Still Too High
According to the Bureau of Labor Statistics (BLS), the US Consumer Price Index rose 0.2% in July to 3.2% on an annualized basis.
• CPI peaked at 9.1% in June 2022. The declining inflation in the past year is a welcome development and signals that the Fed tightening policy is working;
• The key driver of low CPI reading is the double-digit decline in energy cost when compared to the record gasoline price last year. This is misleading and lagging data. Gasoline and diesel prices are both on the way up for months;
• The Core CPI, excluding energy and food, is 4.7%. Compared to 5.9% in July 2022, the decline is not fast enough, and it is still too high;
• At 7.7%, Shelter leads all categories and has the highest price increases. Higher interest rates pushed up mortgage payments and rents. This could lift overall inflation higher in the coming months.
The Fed’s preferred inflation metric is the PCE price index. According to the Bureau of Economic Analysis (BEA), PCE price index for June increased 3.0% on an annualized basis. Excluding food and energy, the core PCE increased 4.1% from one year ago.
The BEA is scheduled to release July PCE data this week. The new reading would influence the Fed as it debates whether to pause or continue raising rates in the September 20th FOMC meeting.
US Economic Outlook: Very Resilient
According to the BEA, US real gross domestic product (GDP) increased at an annual rate of 2.4% in the second quarter of 2023. In the first quarter, real GDP increased 2.0%.
• Current‑dollar GDP increased 4.7% at an annual rate, or $305.2 billion, in the second quarter to a level of $26.84 trillion;
• After the US central bank aggressively raised interest rates from 0.25% to 5.50% in a year and a half, the US economy shows remarkable strength.
According to the BLS, total nonfarm payroll employment rose by 187,000 in July, and US the unemployment rate changed little at 3.5%. Job gains occurred in health care, social assistance, financial activities, and wholesale trade.
As long as unemployment remains low, American consumers would continue to buy goods and services, pay their bills, and service their debts.
• US mortgage delinquency rate was 1.72% in Q2, the lowest in 17 years (vs. 1.74% in Q3 2006), according to the Federal Reserve Bank of St. Louis;
• Auto loan delinquency rates have risen from Q1 2021's 1.43% to 1.69% in Q1 2023, according to a recent Credit Industry Insight Report (CIIR) by TransUnion.
• US credit card loan delinquency rate was 2.77% in Q2, up from 2.43% in Q1 and 1.59% from year-ago quarter;
Why are we seeing different trends? I think that most homeowners locked into low 15- or 30-year fixed mortgage rates before the Fed rate hikes.
Auto loans have shorter duration, usually between 4 to 7 years. Since last year, car buyers now were hit by both higher prices and higher interest rates.
Credit card default is elevated, but still low from a historical perspective. In the 1990s and early 2000s, delinquency rates hovered around 3-5%. It peaked at 6.77% in 2009 after the financial crisis. Credit card companies charge floating interest rates. In January 2022, before the rate hikes, interest rates averaged around 16%. They are now above 24%.
My takeaways
Overall, my assessment is that US inflation is not likely to go down to 2% by 2024. While consumers are under stress, it’s not enough to push the US economy into a recession.
Therefore, I believe that the Fed would keep higher interest rates for a longer period. At each meeting, it would iterate whether to raise or to pause, but not to cut rates.
Impacts to US Stock Market Valuation
Up to now, investors were obsessed with the unrealistic assumptions of Fed cutting rates three to four times in 2024. The Jackson Hole speech is a wake-up call. Stock market valuation will have to be repriced based on new long-term interest rate assumptions.
Higher interest rates raise the cost of capital for all US corporations. Using the Discounted Cash Flow (DCF) stock valuation method, a company’s present value will decline as a higher rate discounts all future cash flows by a greater percentage.
The S&P 500 index has gained 14.75% year-to-date. In recent weeks, it has retreated 200 points (-4.4%) from its 52-week high. The prospect of higher long-term interest rates could put further pressure on the Blue-chip US stock market index.
The Nasdaq composite index has gained 29.85% year-to-date. It has a drawdown of 850 points (-5.9%) from its 52-week high. Even a blowout quarterly profit from chip giant Nvidia failed to lift the leading technology stock index higher last week.
Trade Ideas
On August 11th, 2022, I published a trade idea, “A Tale of Two Americas”. In assessing the impact of Fed rate hikes, I concluded that smaller companies would be hit harder than their larger counterparts. I explored the idea of shorting the lofty valued Russell 2000.
At the time, the Russell was quoted at 1,974 and had a trailing Price/Earnings Ratio of 68.96. Fast-forwarding to August 25th, Russell was settled at 1,853 (-6.1%) and the P/E has collapsed to just 27.61, according to Birinyi Associates and Dow Jones Market Data.
Today, I still favor the idea of shorting the CME Micro Russell 2000 ( FWB:M2K ). Why?
A year ago, the US Corporate BBB Effective Yield was 5.04%. It rose 112 basis points to 6.16% last week, according to Fed data.
After the Jackson Hole speech, I expect the bond yield to move up with the new assessment of higher long-term interest rate. Therefore, Russell 2000 would face further downward pressure.
The March Rusell 2000 contract (M2KH4) was settled at 1,888 last Friday. Each contract is $5 x Index and has a notional value of $9,440 at current market price. CME requires an initial margin of $620.
While shorting a futures contract, an investor could consider setting a stop loss. Hypothetically, a stop loss at 1,800 would limit the loss to $440 (= (1888-1800) * 5).
Happy Trading.
Disclaimers
*Trade ideas cited above are for illustration only, as an integral part of a case study to demonstrate the fundamental concepts in risk management under the market scenarios being discussed. They shall not be construed as investment recommendations or advice. Nor are they used to promote any specific products, or services.
CME Real-time Market Data help identify trading set-ups and express my market views. If you have futures in your trading portfolio, you can check out on CME Group data plans available that suit your trading needs www.tradingview.com

What to Expect in US Inflation Data for July 2023Consensus data,
Headline inflation 3.3, Core CPI 4.8
Scenario 1
If the data prints higher than expected that is core CPI at 5.0 and Headline inflation at 3.5 market participants might interpret inflation as being sticky this will influence them to price for another rate hike either in September or November pushing the fed funds rates to the range of 5.5 – 5.75 percent and expected the fed to keep rates higher for longer. That is dollar bullish especially against the Yen and Swiss Franc.
In this scenario Buy USDJPY and USDCHF but wait until price confirms strong bullish momentum.
Scenario 2
If the data prints as expected that is core CPI at 4.8 and Headline inflation at 3.3 market participants might interpret inflation as being sticky since the core CPI at 4.8 is still far away from the fed target of 2 percent this will influence them to expect the fed to keep rates higher for longer the range of 5.5 – 5.75. That might be dollar bullish especially against the Yen and Swiss Franc.
In this scenario Buy USDJPY and USDCHF but wait until price confirms strong bullish momentum.
Scenario 3
If the data prints lower than expected, that is core CPI at 4.5 and Headline inflation at 3.0 market participants might interpret inflation as falling steadily then price out any further rate hike this year and bring rate cuts for 2024 forward. That is dollar bearish especially against the Yen and Swiss Franc.
In this scenario sell USDJPY and USDCHF but wait until price confirms strong bullish momentum.
Always Let price confirm your views, take your time allow price to settle after the announcement and wait for it to guide you.

jan fed funds futures now trading back at march highsjan fed funds futures now trading back at march highs

We Are One Week Out from the FOMC Rate DecisionNext week is the FOMC rate decision and the markets are pretty confident that there will be no change from the group according to Fed Funds futures (subtracting the contract value of the time frame we are looking for from 100 gives you the loose implied rate).
Interestingly though, the OECD said this morning it expects the Fed to peak at 5.25-5.50 percent which would entail another 25bp rate hike sometime soon. Also, there has been something of a 'hawkish' (or really 'less dovish') shift of late regarding the expectations for policy over the second half of next year. Currently the most anemic forecast for rate cuts in the second half of the year since early March.
Generally, this seems like it is setting up a backdrop that could surprise to either the upside or downside with the right/wrong prodding.

Gold - better levels for longs await Gold is in beast mode - we eye the 2022 and ATHs at $2070 and $2075 respectively and scalper aside it's hard to bet against the momentum play right now
The USD is finding few friends and the ST bear trend is a massive tailwind for gold. We've seen US yield curves looking like they will resume bull steepening and rate cuts are once again being priced into OIS and fed fund futures - gold is not a hedge against inflation per se, but the symptoms of high inflation and tighter policy - i.e weaker growth and possible recession, which will likely require rate cuts to take policy back to neutral - and, of course, continued instability in US financials ahead of Q1 bank earnings on 14 April.
Using a simple rates model as our guide for gold, we can see gold (inverted) has held a strong relationship with the level of cuts priced - I've used the difference between Dec fed funds and May (the peak pricing) - this simplistic model suggests, that in the short-term, gold may be a touch rich and we may see some heat coming out of the move before the buyers step in and we take another leg higher.
Fundamentally it seems bad news equals bad news for the USD, and promotes a higher degree of rate cuts and subsequently gold upside
Its all on Friday's NFP then - a reading <200k jobs and a weaker AHEs could see gold pushing to its ATHs

BOND, huge buying volume on the highs!To all the perma bulls out there, look at bonds, there won't be any pivot till higher interest rates at or above 6%.
Bonds risk-off is the most important out there, as the bond market is much bigger than the stock/indexes market.
Something will have to give, either bonds or the markets...

Rates are rocketingNote the rise of US02MY relative to longer-term rates.
(Thanks to Diego Colman whose chart on a DailyFX page "inspired" this view.)

Bullard talks the terminal rate higherBullard was moving the market today. We think this could trigger a resolve to bring rates/equities back in line again.

TLT ShortTLT is approaching a technical double top area as the Feb. 1st FOMC meeting looms. Fed futures are currently pricing in a 475-500 bps terminal rate, however some fed speakers over the days have indicated a desire to exceed 500 bps this year. Market thus far hasn't bought that narrative and expects the Fed will be forced to pivot later this year due to recessionary headwinds. This pivot hopium has resulted in a rally in TLT. However, if the Fed raises rates to 50bps in February with 2 more rate hikes to go after that, Fed futures should spike above 5%. This will bring TLT crashing down to the 90-100 level. Even if the Fed only raises 25bps with 2 more rate hikes to go, a hawkish stance consistent with their recent comments about continuing rate increases should eat away at the Fed pivot hopium rally and still result in a drop of TLT to the 100 level. EIther way I don't see TLT continuing past 110 in the near term and this opens up a good short oppotunity.
