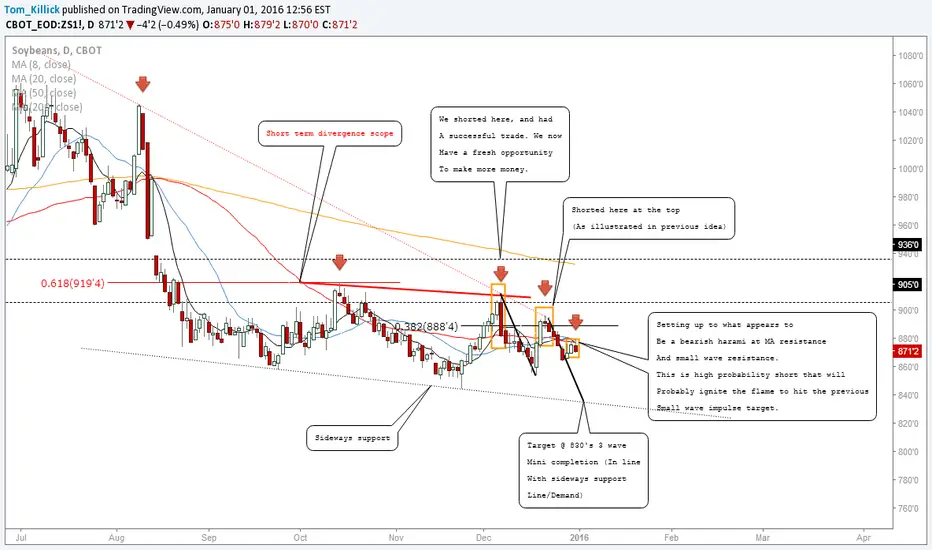
Soybeans: Shorts Favoured Again- Seeking Deeper Move #SoyTraders,
After a short recently, looking to short once again. We're at a good area, pinging off recent divergence, looking for a lower low hopefully. This would, in turn, ignite a deeper correction and give us some downside move. We are at small wave after an impulse and failing at the 20MA. This is the final breath for Soy, and we have a high chance of hitting wave target without any pullbacks now.
Best of luck
Tom
NOTE: For online and face to face personalized tuition, and signals packages, message me here on Trading view, or message me with the email address on my Trading view profile page for temporary discounts.
Thank you.
ZS1! trade ideas
Soybeans: Shorts Favoured Again- Seeking Deeper Move #SoyTraders,
After a short recently, looking to short once again. We're at a good area, pinging off recent divergence, looking for a lower low hopefully. This would, in turn, ignite a deeper correction and give us some downside move.
Best of luck
Tom
NOTE: For online and face to face personalized tuition, and signals packages, message me here on Trading view, or message me with the email address on my Trading view profile page for Christmas discounts.
Thank you.


NOTE:SOYBEAN POSSIBLE WEEKLY WAVE COUNTER It is possible to count, But we need to wait for next spring, And then decide whether to take action!

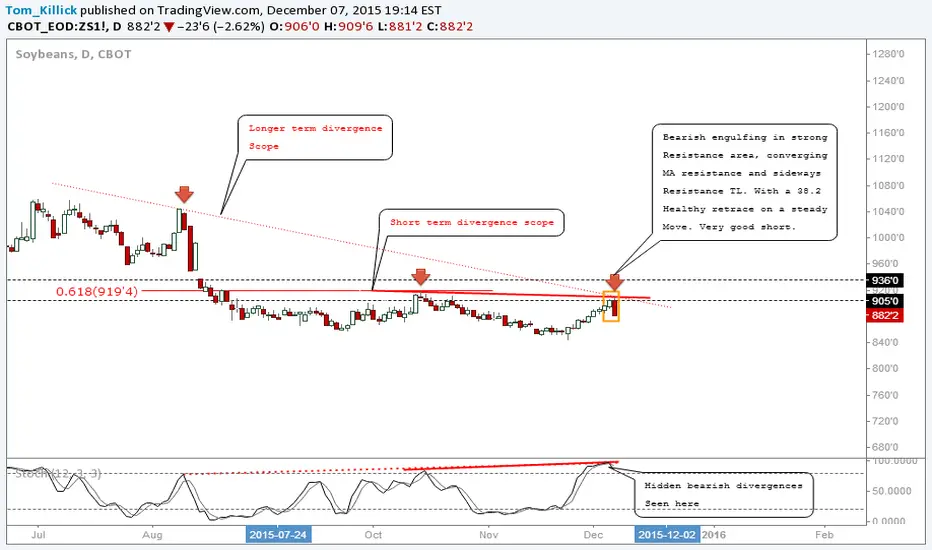
Soybeans: Good Shorting Opportunity After Weak Correction #SoyTraders,
Good opportunity to get a short after a poor correction.
-Strong bearish engulfing
-Verified pullback using Fib levels.
-Verified trend direction using moving averages.
-Demand zones found and predictable assumptions can be made.
-Soy beans are junk and have been this entire year.
With many technical circumstances outlined on my chart, you can see how lucrative this trade could be.
Note:Interested in personalized online or face to face trading tuition? Message me here on Trading view, or email me with the email address on my Trading view profile page
Best regards
Tom
Soybeans - Look at this interesting chartLook at this really interesting chart of Soybeans. I entered long Corn almost a week ago and I was waiting for a good signal on soybeans. The price reached the rejection line of the descending channel. Volumes dropped on the last down move, and the 14 periods RSI shows a strong divergence. I believe a break back above 900 dollars would be a strong bullish signal.

Counter long before/after USDA? #HeikinAshi is positiveI have been hesitating for 3-4 days wether to open or not some long position in Soybeans.
Finally I did it today, but as the big picture is still bearish, this position has to be treated as a counter trend trade, which means size is only 0,5 risk unit.
Weekly:
- Long term bearish ichimoku setup, but: Price got far below Kijun Sen (should attract it back), Future Kumo got very thin, as past 52 weeks volatility decreased, actually Senkou B (52 weeks average) is down to 972!
- Possible Heikin Ashi signal for a pull back.
- Obviously USDA report will be decisive today, but if comes positive then haDelta/SMA3 would move back above zero line and in coming weeks we could see a correction up to 950-970 supp/res zone.
Daily:
- Ichimoku setup is bearish, but if Price clearly closes above Kijun Sen, we may see some short covering, with a possible squeeze tgt to 925-950 zone initially.
- Heikin Ashi is bullish. Important to see if haDelta/SMA3 cross above zero can stay after today's report.


Bullish momentum as a consequence of weather conditionsJune brought an abundant wave of relentless storms, almost double the normal monthly rainfall, and a strong rally in grain prices. The wet conditions have spurred a long list of concerns for U.S. farmers and U.S. crop conditions substantially deteriorated in the final two weeks of June, according to the USDA.
Nitrogen leaching and the lack of days available to spray post emergence crop protection chemicals are two of the major concerns affecting crop conditions. Weed, pest, and disease pressure may all increase as the growing season progresses due to the deadly combination of wet and cold weather after planting, followed by delayed spraying.
Also, soybeans are known for an inverted correlation with the US dollar.
Sources:
www.investing.com
www.investing.com
www.whig.com
www.signalfinancialgroup.com
www.investing.com
Commodities are less risky than forex and stocks, but beware of consequences if you trade on other's people ideas anyway.

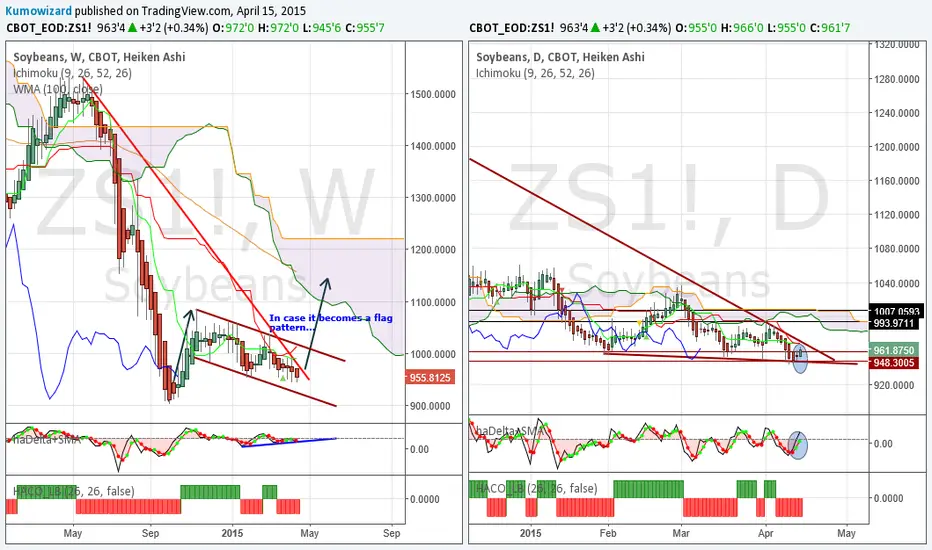
Soybeans - Can it reach 1100?Weekly:
- Ichimoku setup is neutral (bearish consolidation)
- Heikin Ashi setup is bullish, but price has to fight with weekly Kijun Sen and trend channel top. Will it break or will it dip again?
Daily:
- Very impressive move from a double bottom, price soars above Kumo. Chikou Span also ticked above past Kumo, but price faces some headwind at 1000 resistance.
- Heikin Ashi started to show some slowdown in extreme bullish momentum. The short squeeze rally may take a pause, haDelta started to decrease from extreme high.
- We will see some sideaway consolidation or a pull back to 960-965 support, which I think would be an optimal risk/reward entry for longs.

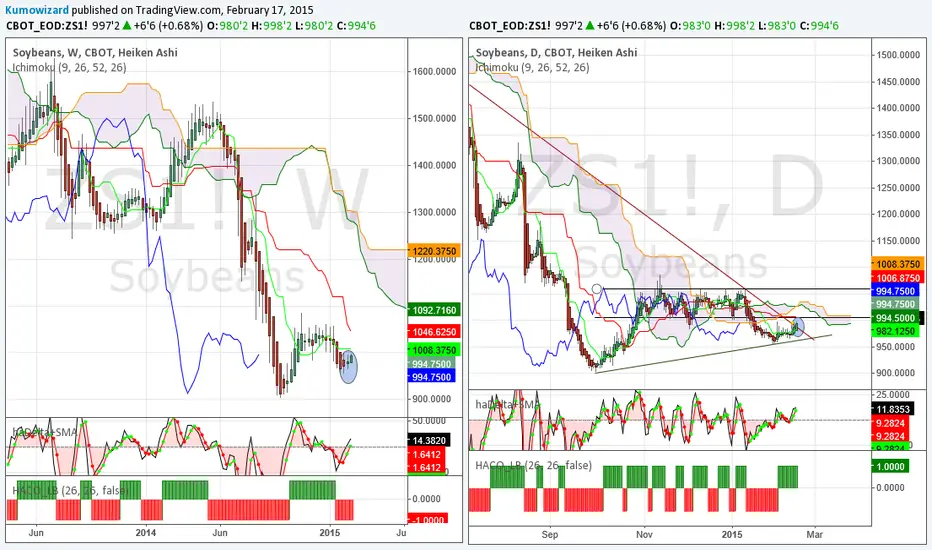
Soybeans - Pull back may be over at bearish Kijun support- Ichimoku setup still in favour of bears. Price retested Kijun Sen. 955-960 seems to be a strong bearish support (trendline, Kijun, Kumo)
- Heikin Ashi signals changes from bullish to neutral: doji candle + haDelta/SMA3 is turning down. As the signal happens at bearish support, we have to be ready for possible bearish swing and trend continuation.
I closed all my swing longs yesterday and today, I enterred some short now at 9,4750.

$SOYBEANS: TARGET 1 COMPLETE!See out PLAN SETUP:
I do appreciate all views be it a like or comment, and if you subscribe to this analysis, you will receive all of our real-time update! Thanks!
SignalSuisse


Soybeans - Small buy with tight stop at last supportWe have quite a mixed picture on Soybeans, as it has really not been trending, still moves in a range, and possibly in a flag. The patterns on both weekly and daily time frames are really interesting, and within next few trading there may be a major move.
Weekly:
- Ichimoku setup is bearish/neutral: Price is below Kumo and Kijun Sen, but Chikou Span hit past 26 weeks candles, and also very interesting to see Kijun Sen (26 weeks avg) to point up, while Tenkan Sen (9 weeks avg) being flat. Anyway this is still minor bearish bias, until Price stays below Kijun and major Trend line.
- Since mid November/2014 weekly price has been drifting lower in a possible flag formation. A break above 974 and later above 1006 is needed for a possible bullish extension to retest 100 WMA and Kumo.
- Heikin Ashi signal is bearish, but we have a few more days left from this week. haDelta/SMA3 is not really convincing, as it is still ard zero line and has some positive divergence.
Daily:
- Ichimoku setup is bearish biased, but can not be called strong bearish until Price can not make a lower low. All Ichimoku average lines are flat, and we have a very thin Kumo above Price.
- Price was pushed down to ultimate support zone 948-958 during last four days, but teh Heikin Ashi signal yesterday and today suggests a possible spike again.
- We also have a possible bullish wedge formation here. A break will occur within a few days. Given the Heikin Ashi signal it is not impossible that the break finally happens on the top side. That would also mean a Price/Kijun Sen weak bullish cross. So the upper level to watch closely is 972! Wether it will be able to break through the Kumo later, or only reaches range top, that remains a question.
I enterred 0,5 unit long position with stop below 942. WI would add 0,5-1 unit more above 972.
Soybeans - Still sideaway, probably more bullish action aheadWeekly:
- After 5 months (!) of range trading Chikou Span hits Price candles. Tenkan and Kijun stay close together, Price is just a bit below Kijun Sen. Ichimoku setup is turning to neutral/less bearish
- Weekly Heikin Ashi candle and haDelta/SMA3 signals a possible bullish move ahead in next weeks
- A Price/Kijun cross would allow gains up to 1060. Since Chikou would then cross past candles, a move to 1100-1150 is also possible.
Daily:
- Multi layered range, with middle equilibrium area at 997-1007
- Ichimoku setup is neutral as Tenkan, Kijun and Senkou lines stay all together and are flat line.
- Heikin Ashi setup is short term bullish again.
- Please note, that is Price breaks above 1007, that will cause longer term bearish trendline break and a Kumo breakout too. More bullish acceleration would come over 1060.
I started to accumulate some longs again.

Soybeans rangeSoybeans (ZSK15) BREAKING OUT to the downside from a 5 months triangle. First target 928.0

ZS Soybeans futures in continued declineIn the accompanying chart I show a high probability support zone for $ZS_F Soybeans at approx. $835 - 790 zone. If demand signals start flipping and firing, that may be a good place to go long. Meanwhile, in the absence of any real demand, I can't see a turn around. The recent lows look vulnerable.

Soybeans bear marketSoybeans monthly chart showing H&S. Targeting 780.0. Find opportunities to enter short. Weakness in the overall bean compelx and grains.

Soybean (ZS) Testing Downchannel/Descending Wedge ResistanceAfter a two week rally, soybean (ZS) is now bumping into downchannel/descending wedge resistance on the weekly chart, which coincides roughly with the 1000 psychologically key resistance level. Weekly RSI and Stochastics are in rally mode, while the MACD which a few weeks back appeared ready for a negative crossover has strengthened again and is sloping up now.
For my multiple timeframe analysis on ZS, feel free to visit: tradablepatterns.com
Website: tradablepatterns.com
FB: facebook.com
Stocktwits: stocktwits.com
Twitter: twitter.com
Linkedin: www.linkedin.com
YouTube: www.youtube.com
Google+: google.com
Email: info@tradablepatterns.com

Soybeans - Accumulate longs! Breakout is loomingWeekly:
- Heikin-Ashi weekly reversal pattern, with haDelta climbing back above zero line.
- Chikou Span got close to Price candles, we may see a weak bullish Chikou cross within next few weeks
- First resistance is Tenkan Sen at 1008, second is Kijun Sen at 1046
Daily:
- Major bearish trendine break?
- HA candle pattern is bullish, haDelta is further up
- Thin Kumo above Price, would be easy to break in case. Chikou Span gets close to Price candles and past Kumo, a cross would mean a medium strong bullish signa.
- First resistance is Kijun Sen at 1007. Above that space opens towards previous range top at 1060.
- A final break above 1060 would validate a bullish Kumo breakout to open route towards 1100.
Start to accumulate longs and add to position on breaks and on retest after relevant level breaks.
The squeeze is comingAbove 998 and the squeeze will have shorts scrambling. A close above this area and we will be looking for triggers long.

Soybeans - Seeking direction, volatility is extremely lowLast two weeks have been boring in Soybeans' market. Small spike up, then back, but in fact it has been trading in a very narrow range. There is total undecision, but the next break will end in a big move.
Weekly:
- Ichimoku setup is still rather bearish, but in fact since October/2014 the bearish bias softenned a lot. Chikou Span is getting close to Price of 26 weeks ago.
- previous HA candle already showed undecision, and this week's candle is something we very rarely see in commodities. It has smaller body than previous one, and its body and wicks are still within the previous candle's.
haDelta is difficult to read, as it is above its SMA3, but still both lines are below zero level
Daily:
- Last 6-7 days were total neutral with no clear HA candles. Price is stuck to Tenkan Sen. Will it change today with a bullish candle and with haDelta crossing up again above zero? We'll see
- Ichimoku picture is also neutral. All average lines are flat, and Chikou Span is neutral too.
- Price is equally close to the major downtrend line and to the shorter term minor uptrend line. Break through one of these lines will decide the next major move, which after such a low volatility period will be a sharp and decent one. Please note that the Kumo is very thin above. So in case Price manages to break the downtrend line it will not be very difficult to break the Kumo as well.
Obviously from the recent setup this model can not decide which direction will come next. but as the space is getting really tight, it worths to watch Soybeans price action in coming days.
For a bullish reversal the key level is ard 1000, bearish continuation requires a break below prev low at 952.

ZS upward "C" wave to come (???)Soybean has been a tough market for those traders seeking volatility as it has been on a “wait-and-see” mode for a couple of month now. I do not expect any major movement on the short/mid run; however, I do see a possibility to “widen” the current trading range.
The wave counting above suggests that a B wave would be completed (or nearly completed) and a possible upward C wave would be on the radar screen. For those (unlike me) seeking short-term opportunities it may be a good commodity to keep track on.
I am still holding my long position with stops on a range around 920, although I confess the weekly chart does not look that bullish. In fact, the MACD divergence is killing my sleep lately.
See my comments on ZC at:
