Sell off across U.S. Equity into Monday U.S. openU.S. equity indicies failed to register new highs at the close of inauguration week on the heels of famed Trump 'tariff talk' and the initiation of mass immigration reform. Friday 1/24/2025 we saw the bulls slightly outnumbered by bearish interest before the 'full weight' of the move was felt coming towards the close of Sydney/open of London session into today Monday, January 27 of 2025. The dollar is weak, the price of metals is subdued as of writing and bonds have sky-rocketed across the board in a clear display of a flight to safety (guaranteed interest during a time of uncertainty in RISK-assets). Due to a clear risk off sentiment reflected in the flight to safety in the bond market, I'm calling U.S. equity indicies to be in a sell-off for monday 1/27/2025 across the board. We have MAGS and FAANG earnings reporting this week in addition to an FOMC meeting this coming Wednesday - While the price action might become a blood-bath for a while, it may or may not be part of an over-due correction of a broader sequence.
ZT2! trade ideas

Can the 2 Year Treasury Note Rally? The recent rally of the 2-year Treasury has unfolded following Federal Reserve Chair Jerome Powell's shift toward a slightly dovish stance in the latest policy meeting. Powell's rhetoric emphasized the importance of proceeding cautiously with the path of interest rates, prompting a surge in demand and short covering in the bond market.
Against this backdrop, the persistent tightening of financial conditions has compounded concerns, with market participants closely monitoring the impact on economic growth. The rally in the 2-year Treasury reflects a repricing in the bond market, as traders and investors feel that the Fed is that closer to the end of this Quantitative Tightening cycle.
Moreover, the specter of shrinking disposable incomes has cast a shadow over consumer spending, exacerbating concerns about the sustainability of economic growth. As disposable incomes dwindle, consumers typically curtail their spending, potentially dampening overall economic activity.
As market participants navigate these uncertain waters, economic data will continue to be a headwind for Treasuries, and Equities.
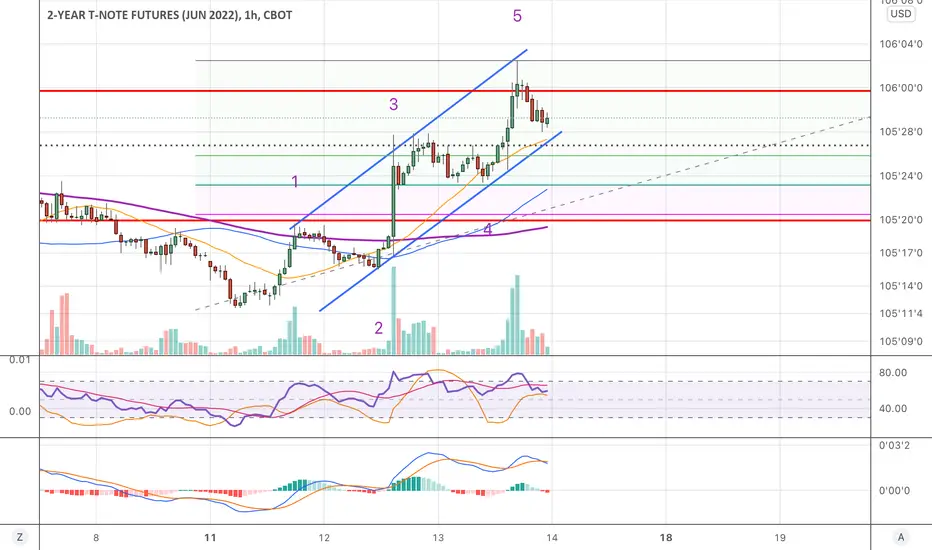
When looking at the technicals of the 2 year Treasury, there is major support from 101 ‘2 – 101 ’10. A break and close below this level would likely be coupled with better than expected economic data, and higher than expected inflation numbers.
Major resistance was previously the trend line going back to the March 24th highs. After breaking and closing above this level, traders should look for a break and close above 101 ’25 to see further momentum.
Check out CME Group real-time data plans available on TradingView here: www.tradingview.com
Disclaimers:
CME Real-time Market Data help identify trading set-ups and express my market views. If you have futures in your trading portfolio, you can check out on CME Group data plans available that suit your trading needs www.tradingview.com
*Trade ideas cited above are for illustration only, as an integral part of a case study to demonstrate the fundamental concepts in risk management under the market scenarios being discussed. They shall not be construed as investment recommendations or advice. Nor are they used to promote any specific products, or services.
Futures trading involves substantial risk of loss and may not be suitable for all investors. Trading advice is based on information taken from trade and statistical services and other sources Blue Line Futures, LLC believes are reliable. We do not guarantee that such information is accurate or complete and it should not be relied upon as such. Trading advice reflects our good faith judgment at a specific time and is subject to change without notice. There is no guarantee that the advice we give will result in profitable trades. All trading decisions will be made by the account holder. Past performance is not necessarily indicative of future results.

The Bottom For the 2 Year Treasury NoteTreasuries have continued to sell off as the Treasury market reprices both interest rate and inflation expectations. Recently, the yield curve has begun to steepen further, and the 2s – 10s inversion has gradually decreased. The longer end of the Treasury market has experienced a significant increase in supply due to Congress's spending increases and liquidation by foreign debt holders. So the question arises: Is this the bottom in for shorter-duration Treasuries, like two year notes?
The two-year Treasury note exhibits interesting technical features. Currently, major trend line resistance and the 50-day EMA have converged at the 101’15 level, serving as a significant resistance point for the two-year note. To gain more upside conviction, we would need to witness a break and close above this level.
A move higher is likely to coincide with softer economic data and inflation returning to the Fed's 2% target. Conversely, if we continue to observe economic strength and persistent inflation, major support will remain at the 101’03’5 level. A break and close below this level is likely to trigger additional liquidation.
While the market is currently undergoing a substantial repricing of longer-duration Treasuries, the two-year note (shorter duration) price change will be less susceptible to interest rate fluctuations. Using the CME Fed Watch tool is an excellent way for traders to monitor the bond market's current view of interest rate expectations
CME Real-time Market Data help identify trading set-ups and express my market views. If you have futures in your trading portfolio, you can check out on CME Group data plans available that suit your trading needs www.tradingview.com
*Trade ideas cited above are for illustration only, as an integral part of a case study to demonstrate the fundamental concepts in risk management under the market scenarios being discussed. They shall not be construed as investment recommendations or advice. Nor are they used to promote any specific products, or services.
Futures trading involves substantial risk of loss and may not be suitable for all investors. Trading advice is based on information taken from trade and statistical services and other sources Blue Line Futures, LLC believes are reliable. We do not guarantee that such information is accurate or complete and it should not be relied upon as such. Trading advice reflects our good faith judgment at a specific time and is subject to change without notice. There is no guarantee that the advice we give will result in profitable trades. All trading decisions will be made by the account holder. Past performance is not necessarily indicative of future results.

Key Levels and US Market Review for the Asian session open 3/04Major Indexes ended the month and Quarter on a positive note and held the recent trend up although the price action is extended and hints at some profit taking to come. We are now into a new quarter so could see some longs unwind into the new week; add to that the spike in Oil (cough, cough...manipulation from OPEC); and markets will see some increased volatility. With US Key employment data at the end of the shortened week, I feel new bulls will remain on the sidelines into Easter.
Asian markets are expected to open stronger but may find some weakness as they digest the macro economic costs of higher Oil prices.
I remain of the view that sticky inflation is the big issue but it remains a balancing act for the Fed as they potentially come to the end of a rate rise cycle. With the OPEC Production cuts and resultant spike in Oil, bulls will have something to think about regarding inflation.
A review of the price action from the European session and the US session where I look at some key levels to watch and the price action setups I expect to see play out on the major markets below.
Markets covered :-
DOW
Nasdaq
DAX
FTSE
ASX200
Hang Seng
USD Index
Gold
Oil
Copper

Key Levels and US Market Review for the Asian session open 9/03A review of the price action from the European session and the US session. Major indexes were generally range bound to mildly higher. Inflation and rate rise expectations kept the major indexes under pressure with the focus now on the major US employment data release. The USD held onto the recent gains while US bonds held onto the recent lows.
I remain of the view that sticky inflation is the big issue and will weigh on share markets if the Fed, and other major central banks, can not get it under control.
I look at some key levels to watch and the price action setups I expect to see play out on the major markets below.
Markets covered :-
DOW
Nasdaq
DAX
FTSE
ASX200
Hang Seng
USD Index
Gold
Oil
Copper

Key Levels and Market overview for the Asian session open 27/02A review of the price action from the European session and US session as traders go into 'risk off' mode on stronger than expected inflationary data. The US gapped down on the open and held the lows into the close. The USD continued higher while US bond yields again rallied which pressured the broader share market. I look at some key levels to watch and the price action setups I expect to see play out.
Markets covered :-
DOW
Nasdaq
DAX
FTSE
ASX200
Hang Seng
USD Index
Gold
Oil
Copper

Key Levels and Market overview into the Asian session openA look at the price action from the European and US sessions and what that may mean for the Asian market open after PPI out in the US was stronger than expected adding fuel to the inflation fire. I feel data is still showing 'sticky inflation' which eventually leads to higher interest rates and lower spending which will cap the indexes. Intraday the US could not hold up off the lows and was hit hard into the close with potential to continue lower. I look at some key levels to watch and the price action setups I expect to play out.
Markets covered :-
DOW
Nasdaq
DAX
FTSE
ASX200
Hang Seng
USD Index
Gold
Oil
Copper

The yield curve has to un-invert eventually… right? (Part 2)This week, we thought it will be interesting to review the trade from last week given the reaction post-FOMC, as well as discuss an alternative way to set up this trade.
Firstly, let’s review the post-FOMC/employment data reaction.
- Nonfarm Payrolls surprised to the upside, as over half a million jobs were added way above the estimates of a sub 200K number.
- Unemployment rate continues to fall further, reaching a 53-year low of 3.4%
A clear re-pricing has occurred since last Friday’s better-than-expected jobs data and Wednesday’s Federal Reserve meeting. With markets now expecting 1 more rate hike in May, bringing the peak rate up from the 475 -500 bps range to the 500-525 bps range.
Keeping this in mind, we go back to our analysis last week to understand this situation and historical precedence.
While the time for a pause in rate hike seems to be pushed back, in the grand scheme of things, we think that this has only kept the window of opportunity for this trade open for longer and at a more attractive entry point now.
Without repeating ourselves too much, we encourage readers to take a look at our idea last week which explores the historical correlation between the peaking of yield curve inversion and the pause in Fed rate hikes.
Link to our last week’s idea:
This week, let’s tap into a different instrument. Here, we aim to take a short position on the 2Y-10Y yield differential by creating a portfolio of Treasury futures to express this view.
To do so, we would have to first select the 2 instruments, the 2-Yr Treasury futures is a straightforward choice for the short end. But for the 10-Yr leg, we have a choice of the '10-Yr Treasury Note Futures' vs the 'Ultra 10-Yr Treasury Note Futures'. Digging into the contract specification, the 'Ultra 10-Yr Treasury Note Futures' provide a better proxy for the true 10-year duration exposure as the delivery requirements are for Treasuries with maturities between 9year 5 months and 10 years. In comparison, the underlying of '10-Yr Treasury Note Futures' has a maturity between 6 year 6 months and 10 years.
With contract selection out of the way, the next step is to calculate the Dollar Neutral spread. This requires us to identify the DV01 of the front and back legs of the spread and try to match them. This is to ensure that the entire position remains as close to dollar neutral as possible, so we can get a 'purer' exposure to the yield difference between the front and back legs, and parallel moves are negated. CME publishes articles on this topic to explain the setting up of a DV01 spread clearer than we can explain. You can find them attached in the reference section below.
You can handily find the DV01 of the Cheapest To Deliver (CTD) securities on CME’s website.
In this case, we are looking at the 2Yr and Ultra 10Yr Treasury Futures to set up the trade. With the DV01 of the 2Yr at 34.04 and the DV01 of the Ultra 10Yr at 96.26.
The spread ratio can be calculated as 96.26/34.04 = 2.83. Rounding this to the nearest whole number, we would need 3 lots of2-Yr Treasury Future and 1 lot of Ultra 10-Yr Treasury Future, to keep the DV01 equal (neutral) for both legs of this portfolio.
Given our view of the 2Yr-10Yr yield spread turning lower, we want to short the yield spread. Yield and prices move inversely, hence, to short the yield spread, we long the Treasury Futures spread as it is quoted in price. We can long 3 ZTH3 Futures (2Y Treasury Future) and short 1 TNH3 futures (Ultra 10Y Treasury Future) to complete 1 set of the spread. However, since the 2-Yr Treasury Futures has a notional value of 200,000 while the Ultra 10Y Treasury Futures a notional of $100,000, the price ratio will be 6:1 when the position/leg ratio in the spread trade is 3:1. As such the current level would provide us with an entry point of roughly 494 with a minimal move in Ultra 10yrs representing 15.625 USD and that in 2Y representing 7.8125 USD.
While slightly more complex in setting up, this trade allows us another alternative to express the same view on the yield curve spread differential. Being able to execute the trade via different instruments allows you to pick the most liquid markets to trade or take advantage of mispricing in the markets.
The charts above were generated using CME’s Real-Time data available on TradingView. Inspirante Trading Solutions is subscribed to both TradingView Premium and CME Real-time Market Data which allows us to identify trading set-ups in real-time and express our market opinions. If you have futures in your trading portfolio, you can check out on CME Group data plans available that suit your trading needs www.tradingview.com
Disclaimer:
The contents in this Idea are intended for information purpose only and do not constitute investment recommendation or advice. Nor are they used to promote any specific products or services. They serve as an integral part of a case study to demonstrate fundamental concepts in risk management under given market scenarios. A full version of the disclaimer is available in our profile description.
Reference
www.cmegroup.com
www.cmegroup.com
www.cmegroup.com
www.cmegroup.com

ZT D1: Buy by market SL 103.24 TP1 105.15The bonds enter bullish phase of cycle till the middle of Oct.

ZT! - breaking outZT was banging its head against cyan resistance area, but it seems it is finally breaking out.
I would conlcude that FED tightening cycle is over, probably not actual raising of fed funds rate, but hawkish speek.

ZT - Two year note - end of bear market?There is a fairly clear impulse wave to the upside in the two year. It should find support at 105,20-105,23 level.


Market Recap and levels to watch for the coming sessionsMorning Jumpstart 25-01-22
US Bounced bark hard from a weak open after trapping and squeezing some sellers. Bargain hunters were out in force expecting that the selloff is over and its time to buy the Dip. I feel that we may have seen the highs put in place and may expect a further unwind of bulls as inflation and interest rate rises kick in. More in the video....
Thanks for watching and please take some time to check out the website.

ZTThis detail of price development to the hourly chart is based on a previously published global analysis.


Dump Bonds - Buy BTC & LTCBonds will dump back to the monthly 55ema over the next month
Hedge against inflation with Bitcoin and Litecoin (not centralized defi scams)
2008 play by play
Gotta get up to get down

ZT1!. P-Modeling Pt 3. The Bonds of Cajuns within Two YearsWelcome to the Hyperspace.
Today we look at the correlation between Covid-19 and Two Year T-Note Futures ZT1! .
Please see Pt 2 for Idea Development.
Wave One of Covid-19: Feb - March till June 2020.
Wave Two of Covid-19: June-Dec 2020
I have bonds going all the way to 117'', with a wick even higher for Short Entries.
Current is.. 110''15'3
_____________________________________________________
Looking for distinct stepping pattern.
Presidential Transition.
Joe Biden will be out.
Bernie Sanders will be in.
Trump will lose to Sanders with a landslide victory in the 87% range.
Bernie Sanders wins 2020 United States Presidency.
Cue. Enter the Roaring 20s.
______________________________________________________________________
Sequence --> COVID-19 Wave One -----> Civil Unrest ---> COVID-19 Wave Two ---> Civil Unrest ---> Covid-19 Wave Two Criticality --> Civil Unrest ---> Presidential Transition ---> Civil Unrest ---> Bernie Sanders Wins 2020 Presidency.
SPX will be decimated. Stocks will Execute Black Swan.
Interesting Times Indeed.. But will it manifest?
Of course it will.. We are Cajun's of the Light.
This sure is going to be one of the craziest rides in American History,
Thanks for Pondering the Unknown with Me,
Glitch420

ZT1!. P-Modeling Pt 2. The Unthinkable Proposition of Cajun's. Welcome to the hyperspace correlation between Covid-19 and Two Year T-Note Futures ZT1!.
Wave One of Covid-19: Feb - March till June. Big increase in Bond Buying. Then curve is flattening.
Wave Two of Covid-19: June till November. Round Two & Three.
Looking for distinct stepping pattern.
Presidential Transition.
Bernie Sanders wins 2020 United States Presidency.
Sequence --> COVID-19 Wave One -----> Civil Unrest ---> COVID-19 Wave Two ---> Civil Unrest ---> Covid-19 Wave Two Criticality --> Civil Unrest ---> Presidential Transition ---> Civil Unrest ---> Bernie Sanders Wins 2020 Presidency.
Interesting Times Indeed.. But will it manifest?
This sure is going to be one of the craziest rides in American History.
Thanks for Pondering the Unknown with Me,
Glitch420

Moar Steepening!We made quite a bit of money last night being long $ZT_F and short $ZF_F and we're putting the trade back on right now. We think there's a ways to go here - too many people caught way offsides by this bond dump.

2s/5s Ready to Steepen?$ZT_F vs. $ZF_F: looks like a rounded bottom is forming with a little bullish wedge over the last 8 hours. Inflation IS becoming a concern globally, so this should have some legs.
