ZW1! trade ideas

If you already didn’t sell be ready to sell now Because we’ve a bearish pullback the will continue descending

Idea on US Wheat: Head & Shoulders pattern- Strong support at $6.80/bu with strong rejection candlesticks (hammer)
- Bullish engulfing on this support
- Rebound on the 150 Exponential Moving Average
- Broke up the 100 Exponential Moving Average
- Rebound on the 38.2% Fibonacci retracement level
- Hidden bullish divergence on Relative Strenght Index ( RSI )
- Head & Shoulders pattern
Fundamental news:
- Cut of worldwide wheat production
- Oversold position before monthly USDA report
Objectives:
Wheat could goes up to the $7.22/bu level (61.8% Fibonacci retracement level) and then goes down and confirm the Head & Shoulders pattern. The theoretical objective is $5.80/bu (support). Before this level, there is a strong support at $6.20/bu. WHAT DO YOU THINK ABOUT THIS IDEA?
Feel free to share, comment and give your opinion if it is constructive ;)
DISCLAIMER: This is not investment advice

Wheat Futures: Likely to Rally?Anticipating higher prices for Wheat Futures
Commercials are net long, and market structure is favoring higher prices.

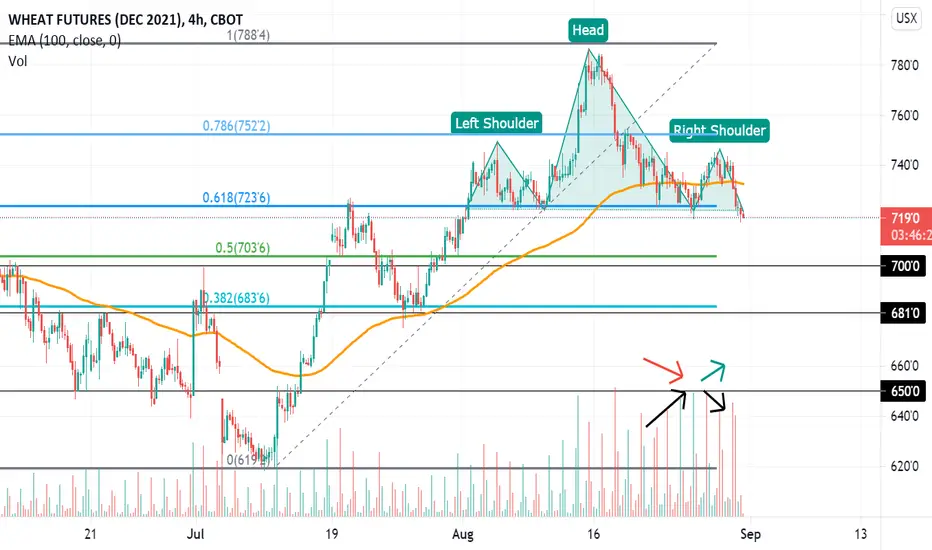
BEARISH ON US WHEAT DEC21Bearish clues:
- The general trend has been downward since mid of August 2021
- Wheat has formed a Head & Shoulders pattern (with the 61.8% Fibonacci retracement level as the neckline). This neckline was broken down yesterday with a large amount of volume
- The right shoulder formed a double top
- The volume indicates that sellers took the advantage: when the price dropped, the volume increased / when the price went up (formation of the right shoulder), the volume decreased
- The price of wheat has broken the 100 exponential moving average
Fundamental news:
- Take profit by investors after last week's rise
- Hurricane Ida caused the closure of several ports on the Atlantic coast, through which soybeans and corn are exported. Wheat has been dragged into the downward spiral of these commodities
- StatCan released low Canadian wheat production numbers (- 34.8% compared to last year) but higher than expected
- Spring wheat harvest is progressing is the United States of America (88% done VS. 71% historically at this date)
- Oil price remains low
Objectives:
Wheat could first decrease to the $7.00/bu level (support and 50% Fibonacci retracement level). And then maybe to the $6.80/bu level (support and 38.2% Fibonacci retracement level) or will rebound on the support levels and will go up again if there are more positive news on Chinese imports and bad news on US harvest. Last objective is between $6.60/bu (theoretical objective of the Head & Shoulders pattern) and $6.50/bu (support)
Feel free to share, comment and give your opinion if it is constructive ;)
DISCLAIMER: This is not investment advice
BEARISH ON US WHEAT (SHORT-TERM)Bearish clues:
- The general trend has been downward since mid of August 2021
- Wheat price has reached the resistance at $7.71/bu and the middle of the Andrews' Pitchfork
- The price of wheat has already broken down a bullish channel
- The price of wheat has already broken down the 50% Fibonacci retracement level of the last swing and the 78.6% Fibonacci retracement level of the last big up move
- The price of wheat has broken the 20 exponential moving average
Fundamental news:
- The USD is more and more stronger, which is bearish for US commodities
- Drop in oil prices
- Take profit from investors
- Better climate conditions in the North-East (wheat suffered from drought. Only 11% of spring wheat in the US are considered as good quality (spring wheat represents 25% of wheat acreages in the US => - 11% on the US wheat production YoY (Source: USDA).
Objectives:
Wheat could first decrease to the $7.10/bu level (support). And then maybe to the $6.90/bu level (50% Fibonacci retracement level and bottom of the Andrews' Pitchfork) or will rebound on the support level and will go up again if there are more positive news on Chinese imports and bad news on US harvest.
SHORT-TERM: BEARISH
MID-TERM: WAITING THE END OF THE US HARVEST
Feel free to share, comment and give your opinion if it is constructive ;)
DISCLAIMER: This is not investment advice

Wheat Futures (DEC 2021)3 wave pattern
Two patterns completed, 3 joining wave patterns completed. Making the next wave either a 3 wave or a 5 wave.
It traded to a retracement zone of 0.5% which is the point of entry in a corrective pattern for some of us
Currently, futures short covering is an extra condition to go long,
LONG


If Commodities Break Up, The Fed is in a "Pickle". Watch DBCThe Fed keeps pumping money into markets, saying inflation is "transitory". If these commodities break up, they will have to finally change their tune. I watch DBC and DBA, the commodity indexes ETFs.

ZW long buy target 850Good setup for technical analysis
Good fundamentals, tight supply, high demand

ZW Small Time-Frame Buy Pressure Hi every one
ZW break VWAP then return for Pullbak this is a great indicateur for buy
Traders, if you liked this idea or have your opinion on it, write in the comments, I will be glad.
Thank you for seeing idea .
Have a nice day and Good luck

short wheat - failed breakout, & confirmation of existing wedge saw wheat form a wedge which saw an upside move higher. The price break did not hold and it fell back into the existing wedge within a week. It broke down through the lower bound of that wedge today which confirms a move to the early formation of the wedge. A potential extension forms when that wedge may confirm a larger double top. GLTA

Wheat going nice , soon 875$my eoy target is above 1000$. i have been following wheat for one year now lets see if we can reach all times high this year.

analysis zw daily hello traders
today i share with you my view about zw , there is potential in this chart it is solid

wheat futes searching for bid above 18'4If we break above 18'4 we will likely retest the highs as the recent highs were front run with resistance slightly above there. If we take out the recent low, I'm neutral as no clear sign that we retest the recent low all the way down at 594. The fact that we moved above recent resistance should favor the bulls. Wave pattern is suggestive of correction rather than new impulse down.
See my other post on corn. One way of playing this would be to engage in a spread trade e.g. long wheat/short corn, depending on price action.

Wheat Futures September 2021 ContractThe pattern is currently doing a sideways or consolidation in 1 HR and below. It looks like the selling pressure is present unless if its breaks the red line resistance with a strong buying force. Other confluence for shorts are:
1) Pattern making a reversal at a 61.8 Fibo level
2) Seller coming in, can be seen in Volume
3) Bullish momentum getting less and less
4) Price break 100MA, but yet to respect it.
Entry guidelines:
- I will wait for the price to break the trendline and the support area before going into a position targetting 160-170 ticks below.
Good luck!

Bullish Arc forming on Wheat pricesA bullish Arc on the Wheat futures contract suggests a move of at least 100% by 2026.

Elliott Wave Analysis: WHEAT Is Still Looking For The BottomHello traders and investors!
Today we will talk about commodities, specifically WHEAT, in which very interesting development.
Well, as you know, commodities have been very bullish for the last year and some of them made strong and impulsive rise, but this is not the case for WHEAT, as we see slower price action and corrective wave structure from the lows.
We are talking about (A)-(B)-(C) flat correction where wave C has ended within an ending diagonal (wedge) pattern. The whole structure belongs to a higher degree wave IV correction of a bigger monthly wedge shape that can send the price back to lows for wave V before market finds the bottom.
What we want to say is that maybe it's time for a slow down in the commodity market, where WHEAT could be on of the weakest, especially after recent strong and impulsive decline back below lower ending diagonal pattern, which confirms that correction from the lows is completed, but real bears may show up below 600 region!
Be humble and trade smart!
If you like what we do, then please like and share our idea!
Disclosure: Please be informed that information we provide is NOT a trading recommendation or investment advice. All of our work is for educational purposes only.


