Wheat Breaks Below SupportWheat
Technicals (May)
May wheat futures broke lower yesterday, after struggling to maintian price action above trendline support in the previous two sessions. This has the Bear camp back in the driver’s seat as we officially enter the back half of the week. A close back above 550-555 would neutralize the recent bearish action.
Bias: Neutral/Bearish
Resistance: 573 1/2-575, 595 3/4-600, 608 1/2-611**
Pivot: 550-555
Support: 537-540*, 525
Fund Positioning
Friday’s Commitment of Traders report showed Funds were net buyers of about 5.4k contracts. That trims their net short position to 86,568 contracts.
Seasonal Trends
(Past performance is not necessarily indicative of future results)
Below is a look at price averages for July wheat, using the 5, 10, 15, 20, and 30 year averages. Historically this isn’t the most friendly time of year.
Check out CME Group real-time data plans available on TradingView here: www.tradingview.com
Disclaimers:
CME Real-time Market Data help identify trading set-ups and express my market views. If you have futures in your trading portfolio, you can check out on CME Group data plans available that suit your trading needs www.tradingview.com
*Trade ideas cited above are for illustration only, as an integral part of a case study to demonstrate the fundamental concepts in risk management under the market scenarios being discussed. They shall not be construed as investment recommendations or advice. Nor are they used to promote any specific products, or services.
Futures trading involves substantial risk of loss and may not be suitable for all investors. Trading advice is based on information taken from trade and statistical services and other sources Blue Line Futures, LLC believes are reliable. We do not guarantee that such information is accurate or complete and it should not be relied upon as such. Trading advice reflects our good faith judgment at a specific time and is subject to change without notice. There is no guarantee that the advice we give will result in profitable trades. All trading decisions will be made by the account holder. Past performance is not necessarily indicative of future results.
ZW1! trade ideas

Wheat Futures Riding a Fine LineWheat
Technicals (May)
May wheat futures traded in a wide range yesterday, on both sides of unchanged. This morning, prices are attempting to firm as the market revisits our pivot pocket from 550-555. The Bulls will want to see consecutive closes back above this pocket to spur a move back towards the recent highs. A failure to do so could put the Bears in the driver's seat.
Bias: Neutral
Resistance: 573 1/2-575***, 595 3/4-600***, 608 1/2-611**
Pivot: 550-555
Support: 537-540***, 525**
Fund Positioning
Friday's Commitment of Traders report showed Funds were net buyers of about 5.4k contracts. That trims their net short position to 86,568 contracts.
Seasonal Trends
(Past performance is not necessarily indicative of future results)
Below is a look at price averages for July wheat, using the 5, 10, 15, 20, and 30 year averages. Historically this isn't the most friendly time of year.
Check out CME Group real-time data plans available on TradingView here: www.tradingview.com
Disclaimers:
CME Real-time Market Data help identify trading set-ups and express my market views. If you have futures in your trading portfolio, you can check out on CME Group data plans available that suit your trading needs www.tradingview.com
*Trade ideas cited above are for illustration only, as an integral part of a case study to demonstrate the fundamental concepts in risk management under the market scenarios being discussed. They shall not be construed as investment recommendations or advice. Nor are they used to promote any specific products, or services.
Futures trading involves substantial risk of loss and may not be suitable for all investors. Trading advice is based on information taken from trade and statistical services and other sources Blue Line Futures, LLC believes are reliable. We do not guarantee that such information is accurate or complete and it should not be relied upon as such. Trading advice reflects our good faith judgment at a specific time and is subject to change without notice. There is no guarantee that the advice we give will result in profitable trades. All trading decisions will be made by the account holder. Past performance is not necessarily indicative of future results.

CBOT wheat down on good crop conditions, forecast for more rainChicago Board of Trade (CBOT) wheat futures declined for a second straight session on Tuesday after the U.S. Department of Agriculture (USDA) rated the winter crop at its highest early spring level in five years.
-The market was also pressured by crop-boosting rains forecast for the southern U.S. Plains wheat belt and by limited U.S. export demand due to cheaper grain offered by rival suppliers.
-CBOT May soft red winter wheat ended 11-3/4 cents lower at $5.45-1/2 a bushel.
-K.C. May hard red winter wheat fell 12-1/4 cents to end at $5.63-1/4 per bushel, and MGEX May spring wheat MWEK24 ended down 7-1/4 cents at $6.27-1/2.
-The USDA on Monday said 56% of the U.S. winter wheat crop was is good to excellent condition, the highest for this time of the season since 2019.
-India has asked global and domestic trade houses to avoid buying new-season wheat from local farmers to help the government-backed Food Corporation of India procure large quantities to shore up its depleting reserves.

CBOT wheat rebounds on technical buying, short coveringChicago Board of Trade (CBOT) wheat futures rebounded on Wednesday after two sessions of losses as technical buying and short covering lifted the market.
CBOT May soft red winter wheat ended 10-3/4 cents higher at $5.56 a bushel. The benchmark contract fell to a one-week low early in the session but found technical chart support at its 20-day moving average.
Commodity funds hold a sizable net short position in CBOT wheat futures, leaving the market open to short-covering rallies.
A softer dollar was also supportive as it makes U.S. grains more competitive globally.
K.C. May hard red winter wheat settled up 17-1/4 cents at $5.80-1/2 per bushel after earlier falling to its lowest since March 6.
MGEX May spring wheat ended up 12 cents at $6.39-1/2 a bushel.

Wheat near significant bottom, inflation comingWheat has finished 5 waves down of the expanded flat structure that started in Mar 2008. The next up should be a rally to ATH. Inflation is coming.

CBOT wheat ends lower on higher crop condition outlookChicago Board of Trade (CBOT) wheat futures fell on Monday as traders expected the U.S. Department of Agriculture (USDA) to report the strongest winter crop ratings in eight years in a weekly report due for release later in the day.
Wheat futures were also pressured by large global stocks and limited U.S. export demand as rival suppliers are offering their shipments at lower prices.
CBOT May soft red winter wheat ended 3-1/4 cents lower at $5.57 a bushel.
K.C. May hard red winter wheat fell 9-3/4 cents to end at $5.75-1/2 per bushel, and MGEX May spring wheat ended down 10-1/4 cents at $6.34-3/4.
The USDA is due to release its weekly crop condition estimates at 3:00 p.m. CDT (2000 GMT). Reuters expect winter wheat to be rated 57% good to excellent, which would be the highest for this time of the season since 2016.
On average, also expect the USDA to report spring wheat at 2% planted as of Sunday.
The USDA on Monday morning said export inspections of U.S. wheat in the week ended March 28 totaled 498,989 metric tons, above trade estimates for up to 425,000 tons.

Seasonal Weekly Chart For WheatSupply and demand zones for Wheat on the weekly chart.
Once you enter the zone, look for the lower timeframe reversal patterns, extended waves, classic trendline breaks, etc.
Drop down to the Daily for refined supply and demand zones.
Drop down to 1 hour chart for the current trend after you see the reversal pattern.

wheat in strong downtrendwheat is ready to go... excellent RR here... not only 3.5 to first target, but ocasion to build position towards much lower... moving stops to Be or trail
*not financial advise

Wheat @ $540Wheat prices are high,
Over the month you will notice this change and
so you may be asking yourself why?
--
The wheat prices are linked to how well the economy is doing,
knowing this, about its prices you will see by looking at the chart,
That determines this.
--
According to Reuters, China has cancelled buying wheat,
this affects the global wheat prices.
--
Australia is in a farming season, and for this reason the government
is countering the wheat planting time
affected by adverse weather conditioning
--
Wheat is a big global market in the east and southeast of Asia
Right now Australia is the global leader in wheat, beating Ukraine and Russia.
--
This is the right time to plant wheat and sell to the Middle East
and the rest of the world.
--
Rocket Boost this content to learn more.
--
Disclaimer: This is not investment advice. Warning you will lose
money from trading, and so you should learn risk management.

Wheat grinding down toward 5.00Wheat is itching to complete a bat pattern at 5.00… like to see a touch and bullish candle

WHEAT; ZW: A resistance turned supportA monthly bulldiv, a resistance turned support, and a falling wedge on the monthly that is breaking out (to the right) now, what else do you need?
In the Grain complex, farmers have stubbornly held onto their stores past the December 2023 sale period because they didn't like the prices. The storage basis has ticked up since then. Maybe one more month of high basis to really make the storers give up and sell what they've got in the bin. I mean why would you plant more when you still have stuff in the bin? Then I think the new planting season data in Mar/April we will find that planting is underweight on wheat, probably *still* overweight soybeans, and this is just very predictable stuff.
Bin stores Down, planting down ---> Price up
Fading the Soybean mania vs grain complex spread is a very easy agriculture trade. I already did that in a prior Rice vs Soybeans trade. Now Rice is at ATH and Soybeans is down, not because I am that good but because this trade is that easy. The same will happen in grains, which are depressed atm. Remember that livestock feed can be switched to Wheat or Oats or Corn at a moment's notice, and Soybean meal can get removed. This means new bids.
On the chart I really like $9.00 a bushel, just a great mean reversion target, don't get greedy just go for mean reversion. 58% is a tonne of PnL!

Wheat Futures IdeaI will monitor price action on this floor and have set alerts for entry.
Wheat futures need a correction to the upside.
Let me know your thoughts.
The Professor

WHEAT Bearish pressure under the 1D MA50 and MA200.Wheat (ZW1!) has been trading within a long-term Channel Down pattenr since July 2022. The price is currently on a bearish sequence below both the 1D MA200 (orange trend-line) and 1D MA50 (blue trend-line). It appears that technically this is a Bearish Leg following the December 06 2023 Lower High rejection, similar to the one that started on the October 10 2022 Lower High.
That sequence reached the Channel Down bottom on the 1.786 Fibonacci extension. As a result, our long-term Target is 455'7.
-------------------------------------------------------------------------------
** Please LIKE 👍, FOLLOW ✅, SHARE 🙌 and COMMENT ✍ if you enjoy this idea! Also share your ideas and charts in the comments section below! This is best way to keep it relevant, support us, keep the content here free and allow the idea to reach as many people as possible. **
-------------------------------------------------------------------------------
💸💸💸💸💸💸
👇 👇 👇 👇 👇 👇

A quick short-term look at the wheat ZW contractCBOT:ZW1! Wheat is currently located in a weekly Fair value gap . On the daily chart we have been rejected by the FVG (checkpoint "1") and we reached (and totally respected) the volume imbalance (checkpoint "2") . After that point price may go up or down. We should see how market opens in Monday. One possibility is that wheat might be pricing higher , heading towards the buyside liquidity that is located in the checkpoint "3" or maybe the Faire Value Gap that is resting above in the checkpoint "4". One other possibility is that price pass through the volume imbalance and head towards the sell-side liquidity that is resting bellow (checkpoint "5"or maybe "6") but I think it will descent in a slow pace till price finds its needed liquidity to shift its structure.

The weakness of ag-commodities that can be turn into their powerCBOT:ZC1! CBOT:ZS1! CBOT:ZW1! Those commodities had a very interesting price path so far. Since the Russian invasion these three commodities lost a lot of their value. More specifically wheat lost around -50% from its peak, corn -45% and soybeans around -30%. The ag-commodities market is pricing clearly in an oversold area that I think ,in my opinion , is starting to shift slowly its narrative . I think in the next months we could see some buying pressure in the ag-market. The trigger I think is already been pulled and I mean the protests of the farmers in all Europe. If this situation stays as it is today the European farmers won't return to their lands until they get what they ask (lower cost of production). However the lower cost of production as a phenomenon belongs in a healthier economy and I am sure that we are from that healthier financial environment. Geopolitical events , the unstable macroeconomic environment and so much more don't allow the economy to become better or even be stabilized . So, farmers won't give up that easy this time. But this uncertainty can benefit the U.S.-based commodities (wheat, corn soybeans) . In my opinion in the next few months , a gap will be created in the supply-demand chart. People will need food but the marketplace won't be able to fill that need. So European countries could use the us marketplace to fill up their gaps.
disclaimer: this idea is more like a diary and less like an article . I had the need to write down my thoughts about that

ZW1! Wheat Futures Capital Rotation To Commodities?One thing that never seems to change is as one sector advances another lags and while one lags the another advances. The allure of a rising market and fear of reversal in another causes capital rotation.
Looking at risk on assets they have made quite the advance into old highs and some all time highs while many commodities are reaching old lows and past long term support levels.
When looking at these charts technically we can see wheat futures have retraced 75% of its last advance and currently sitting on the last real support resistance flip. Many other commodities such as corn, and soy are sitting in the same position.
If we consider these assets being in a good buy zone technically and look at other assets like stocks and indices, that are in all time high territory the question is where will the profit taking go. The longer an advance lasts the closer it is to the end and while the advance may not be over participants are certainly considering taking profit and rotating capital. When a decline begins fear will cause the rotation from one to the next.
Current Trading Plan:
This a weekly chart of wheat futures and we can see the average range is approximately 55%. Currently accumulating in the bottom portion of the 55% range from the current support level and looking to distribute in the upper 1/8th.
If we consider the average rate of increase from past advances depending on how long accumulation lasts looking at a period of late 4th quarter 2024- 1st quarter 2025
Trade Well......

Sell March wheat market on open 6.54 stopSell March wheat market on open 6.54 stop
looking for what to confirm technical weakness with a USDA report. Aggressive trade!

Wheat i screaming for higher pricesNext big crisis is around the corner .
Bring it on , charts are telling something .

SW: Weak Wheat Prices Are Here to StayCBOT: Wheat ( CBOT:ZW1! )
In stark contrast to the rising stock market, most agricultural commodities have lost ground in 2023. In the Grain & Oilseeds market, CBOT Soybean (ZS) finished the year at $12.73 per bushel, down 14.7% year-on-year. CBOT Corn (ZC) closed at $4.63/bushel, down 30.8% YOY. CBOT Wheat (ZW) settled at $5.93/bushel, down 24.5%.
In the Livestock & Meat market, CME Group Lean Hog (HE) lost 23.2%, while Pork Cutout (PRK) was down 13.0% YOY. Live Cattle (LE) was the only exception with a 10.3% gain.
Despite bad weather, supply chain bottleneck, rising cost of borrowing, and escalating geopolitical conflicts in Europe and the Mideast, farmers around the world managed to produce higher outputs of grain and meat. With food demand remaining weak, this surplus supply pushed the prices of food ingredients downward.
The WASDE Report
Today, we will focus on wheat, which saw huge price volatility in the past five years. According to the latest World Agricultural Supply and Demand Estimates (WASDE) report, published by the United States Department of Agriculture (USDA) last week:
• Global wheat output for 2022/23 was 789.17 million metric tons, up 1.2% YOY;
• Output for 2023/24 was estimated at 783.01 in December but revised up to 784.91;
• Global supplies are raised by 3.6 million tons to 1,056.5 million on higher beginning stocks and production.
In the US, average yield per harvested acre was 46.5 bushels in 2022/23, up 5.0% YOY.
• The WASDE estimated yield to grow 4.5% more to 48.6 bushels in 2023/24;
• Across all wheat varieties, total US production was estimated at 1,646 million metric tons in 2021/22, 1,650 in 2022/23 (+0.2%) and 1,812 in 2023/24 (+9.8%);
• The 2023/24 season-average farm price is forecasted by $0.10 per bushel lower at $7.20, based on prices received to date and expectations for the remainder of 2023/24.
Quick Review of My Previous Trade Idea on Wheat Futures
A rule of thumb for agricultural commodities: Their market prices are very sensitive to supply changes. Due to weather perils, deceases, shipping route blockage, among others, significant uncertainties surround food availability in terms of quantity and quality. On the other hand, demands for agricultural commodities are relatively stable, and have a smaller effect on price changes.
In February 2022, the breakout of Russia/Ukraine conflict sent wheat prices up 70% within two weeks, from $7 to $12 a bushel. The two countries accounted for about 28% of the global wheat export market. Investors panicked that geopolitical conflicts could cut off the wheat supply.
It turned out that the fear was overblown. Despite the ongoing conflict, Russia and Ukraine agreed to keep the Black Sea grain shipping routes open. By July 2022, wheat prices were back to $7.50 a bushel, down 60%.
On June 2022, I published a trade idea on Long Strangle options strategy on Wheat Futures. Below is a follow-up report on how that wheat options trade performed:
Trading with CBOT Wheat Futures
The World Bank forecasts the global economic growth to slow for the third year in a row — from 2.6% in 2023 to 2.4% in 2024, which is almost three-quarters of a percentage point below the GDP growth average of the 2010s.
Slowing economy points to a weak demand for wheat this year. Consequently, the expected wheat supply increase would put further pressure on wheat prices.
Another supporting evidence: I observe that in the past five years, wheat price trend closely tracks that of the US CPI for food (see title chart). Food CPI peaked in August 2022 at 11.4%, but it is sharply down to 2.7% in December 2023. During the period of runaway inflation, food prices were a major contributor to inflation, which drove headline CPI and core CPI higher. Now, food inflation is below both.
The January 16th CFTC Commitments of Traders report (COT) shows that “Managed Money” holds 73,485 long positions and 142,060 short positions on wheat futures. The long/short ratio of 1:2 indicates that speculative traders are bearish on wheat prices.
Last Friday, the March wheat contract (ZWH4) was settled at $5.93 per bushel. In my opinion, wheat prices could fall further to test $5 a bushel, a level not seen since 2020.
Each wheat contract has a notional value of 5,000 bushels, or $29,662 at current price. To acquire 1 contract, a trader is required to deposit an initial margin of $2,500.
Hypothetically, if futures price falls by 50 cents a bushel, a short futures position would gain $2,500 (= 0.50 x 5000). Using the $2,500 initial margin as cost base, a short trader could realize a theoretical return of 100%, excluding commission.
If crop yield is to grow less than expected, or if wheat demand increases more than expected, wheat futures could rise, and a short position will stand to lose money.
Happy Trading.
Disclaimers
*Trade ideas cited above are for illustration only, as an integral part of a case study to demonstrate the fundamental concepts in risk management under the market scenarios being discussed. They shall not be construed as investment recommendations or advice. Nor are they used to promote any specific products, or services.
CME Real-time Market Data help identify trading set-ups and express my market views. If you have futures in your trading portfolio, you can check out on CME Group data plans available that suit your trading needs www.tradingview.com

The game is repeatedThis is the wheat indicator. Three historical upward waves were created, followed by three historical corrective waves to correct the rise that occurred, and then three historical upward waves are created again..
The game is played again and again

BIG Move On Wheat Today!Massive move on wheat today that showed up on our TrendCloud Scanning System.
Let's go over the setup real quick and get you guys ready for any prop trading firms challenge that comes your way.
4 hour chart is down and momentum is down as well.
1 hour momentum is down and 15 min chart is giving us a TrendCloud Signal inside of a Supply Zone.

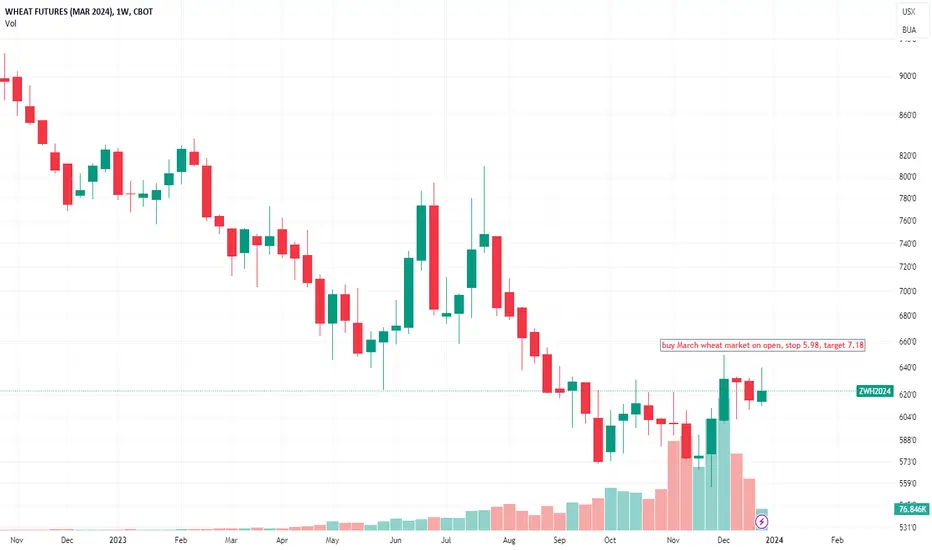
buy March wheat market on open, stop 5.98, target 7.18buy March wheat market on open, stop 5.98, target 7.18
WHEAT ,ZW,futures in 60 minHello to all tradingview investors, according to my previous analysis I see a great opportunity with good probability, the details are reflected in the chart, greetings and good luck to all.
