WHEAT, the downhill seems to slow down,WHEAT, the downhill seems to slow down, but I would not venture new markdowns
The CM_laguerre indicator must discharge, either with a fast down or a lateral phase at these levels
WHEAT - ADX / ADM - TS V. 2.8.4 - Intraday Levels for 30/08/17
ADM - Average Daily Movement - Intraday Levels
Entry on close 1H (hourly candle) ... if exceeded the indicated level
On the ZWZ17 Contract - Dec '17
LONG if> 433.11
TP1 = 438.39
TP2 = 444.25
TP3 = 455.96
Stop Loss = 426.09
SHORT if <426.09
TP1 = 420.81
TP2 = 414.95
TP3 = 403.24
Stop Loss = 433.11
ZW1! trade ideas

WHEAT, weakness comingWHEAT, weakness coming
The CM_ Laguerre indicator says it should go down
in the next few hours. So it's possible to start an entry short entry with
first target at 426.03
WHEAT - ADX / ADM - TS V. 2.8.4 - Intraday Levels for 28/08/2017
ADM - Average Daily Movement - Intraday Levels
Entry on close 1H (hourly candle) ... if exceeded the indicated level
On the ZWZ17 Contract - Dec '17
LONG if> 438.87
TP1 = 444.37
TP2 = 450.49
TP3 = 462.72
Stop Loss = 431.53
SHORT if <431.53
TP1 = 426.03
TP2 = 419.91
TP3 = 407.68
Stop Loss = 438.87

Wheat flat to upI have a big picture tool I use that has been very good to me and it is now indicating shorting puts in wheat will be a good spot to take advantage of a sideways or climbing wheat prices. I will trade the 31 DTE options and will move down to the 30 delta strike put to give it a bit of wiggle room. Not a big trade but not much buying power is used either

WHEAT, weakness comingWHEAT, weakness coming
The Laguerre indicator is ready to discharge, this
could start a short entry in the evening with the target
in area 449
WHEAT - ADX / ADM - TS V 2.8.4 - Intraday Levels for 10/08/2017
ADM - Average Daily Movement - Intraday Levels
Entry on close 1H (hourly candle) ... if exceeded the indicated level
ON the ZWU17 Contract - Sep '17
LONG if> 464.73
TP1 = 470.28
TP2 = 476.44
TP3 = 488.77
Stop Loss = 454.07
SHORT if <454,07
TP1 = 448.52
TP2 = 442.36
TP3 = 430.03
Stop Loss = 464.73


WHEAT, target doneWHEAT, target done
Take profit, the laguerre indicator is beautiful red
and calls downhill. Probably goes down to testing the pivot in zone 463
WHEAT ZWU17 - Sep '17
CROC X1 - Supports / Resistances - Multiday (TF - 1H)
R3 = 481.6
R2 = 480.80
R1 = 468.60
PIVOT = 463.00
S1 = 457.40
S2 = 454.20
S3 = 449.00
CROC X3 - Last Signal (Long Term - TF 1D)
SHORT from 470,40
Since 08/01/17

WHEAT possible entry long to start in the upcoming hourly closinWHEAT possible entry long to start in the upcoming hourly closing times
WHEAT - ADX / ADM - TS V. 2.8.4 - Intraday Levels on 07/08/17
ADM - Average Daily Movement - Intraday Levels
Entry on close 1H (hourly candle) ... if exceeded the indicated level
ON the ZWU17 Contract - Sep '17
LONG if> 460,34
TP1 = 466.31
TP2 = 472.94
TP3 = 486.21
Stop Loss = 448.86
SHORT if <448.86
TP1 = 442.89
TP2 = 436.26
TP3 = 422.99
Stop Loss = 460.34

WHEAT, Short to the test of the support at 457.40WHEAT, Short to the test of the support at 457.40
WHEAT ZWU17 - Sep '17
SHORT since 25.07.2017 from 492.85
Flat Over 491.84
LONG Above 512,00
Stop LONG that close daily <516.03
WHEAT ZWU17 - Sep '17
CROC X1 - Supports / Resistors - Multiday (TF - 1H)
R3 = 481.6
R2 = 480.80
R1 = 468.60
PIVOT = 463.00
S1 = 457.40
S2 = 454.20
S3 = 449.00
CROC X3 - Last Signal (Long Term - TF 1D)
SHORT of 470,40
since 01/08/2017

WHEAT, FLAT.WHEAT, FLAT.
In the last two weeks the dreams of an imminent departure of the grain have broken,
But not everything is lost; now we have reached the lower part of the weekly channel, so the flat position is obligatory, we are seeing, and we enter long with an
hourly close over the 507.50 or short with an hourly close under 491.51
WHEAT ZWU17 - Sep '17
FLAT from 19/07/17 since 504,00
LONG over 507.50
Stop LONG if daily close <511,49
SHORT Under 491.51
Stop SHORT if daily close > 487.52
WHEAT ZWU17 - Sep '17
CROC X1 - Supports / Resistances - Multiday (TF - 1H)
R3 = 559.6
R2 = 559.20
R1 = 508.20
PIVOT = 496.20
S1 = 484.20
S2 = 481.60
S3 = 480.80
CROC X3 - Last Signal (Long Term - TF 1D)
LONG from 470.40
Since 27/06/17

WHEAT, FLAT.WHEAT, FLAT.
In the last two weeks the dreams of an imminent departure of the grain have broken,
But not everything is lost; now we have reached the lower part of the weekly channel, so the flat position is obligatory, we are seeing, and we enter long with an
hourly close over the 507.50 or short with a hourly close under 491.51
WHEAT ZWU17 - Sep '17
FLAT from 19/07/17 since 504,00
LONG over 507.50
Stop LONG if daily close <511,49
SHORT Under 491.51
Stop SHORT if daily close > 487.52
WHEAT ZWU17 - Sep '17
CROC X1 - Supports / Resistances - Multiday (TF - 1H)
R3 = 559.6
R2 = 559.20
R1 = 508.20
PIVOT = 496.20
S1 = 484.20
S2 = 481.60
S3 = 480.80
CROC X3 - Last Signal (Long Term - TF 1D)
LONG from 470.40
Since 27/06/17

WHEAT, the downturn in the last few days should be overWHEAT, the downturn in the last few days should be over
with the support of S1 at 508.2
Now I expect a bounce up to the pivot at 531.70,
then in case of breakage it should continue in area 555.20
otherwise it will consolidate the ascending channel in zone 525
WHEAT ZWU17 - Sep '17
CROC X1 - Supports / Resistances - Multiday (TF - 1H)
R3 = 568.2
R2 = 567.60
R1 = 555.20
PIVOT = 531.70
S1 = 508.20
S2 = 484.20
S3 = 481.60
CROC X3 - Last Signal (Long Term - TF 1D)
LONG from 470.40
From 27/06/2017

WHEAT tested the pivot, now it goes long for the 555
WHEAT tested the pivot, now it goes long for the 555
WHEAT ZWU17 - Sep '17
CROC X1 - Supports / Resistors - Multiday (TF - 1H)
R3 = 568.2
R2 = 567.60
R1 = 555.20
PIVOT = 531.70
S1 = 508.20
S2 = 484.20
S3 = 481.60
CROC X3 - Last Signal (Long Term - TF 1D)
LONG from 470.40
From 2/06/2017
WHEAT tested the pivot, now it goes long for the 555
WHEAT tested the pivot, now it goes long for the 555
WHEAT ZWU17 - Sep '17
CROC X1 - Supports / Resistors - Multiday (TF - 1H)
R3 = 568.2
R2 = 567.60
R1 = 555.20
PIVOT = 531.70
S1 = 508.20
S2 = 484.20
S3 = 481.60
CROC X3 - Last Signal (Long Term - TF 1D)
LONG from 470.40
From 2/06/2017


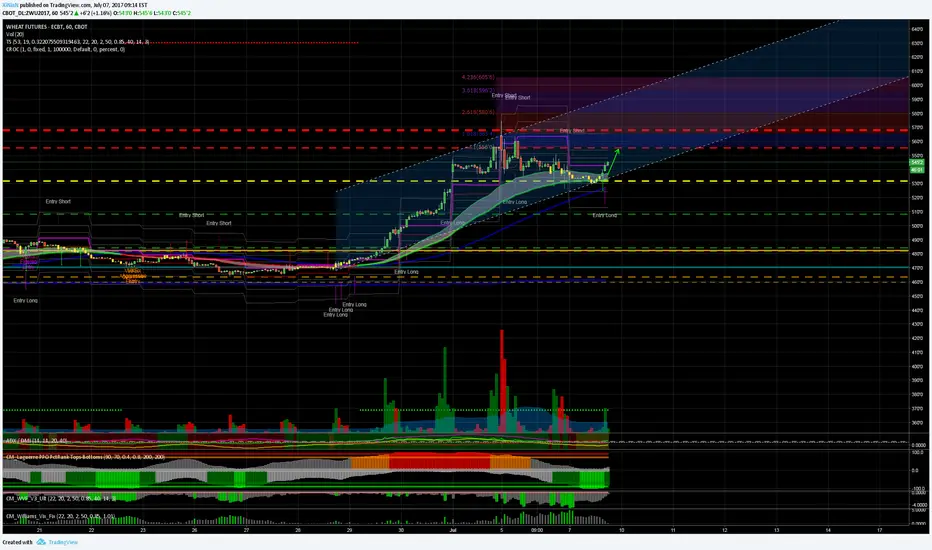
WHEAT, the rally continues
Beautiful session yesterdayon the wheat market, it tested the support in zone 508 and then
there was a wave of buyers that made it reach to the top of the multiday channel.
Now in the upcoming sessions I expect a bit of leakness due to the over-buy
and I think it will lead to consolidation of zone 520.
Then you should start off with the pivot attack and the first resistance in zone 555
I would palace the stop in zone 508
WHEAT ZWU17 - Sep '17
CROC X1 - Supports / Resistance - Multiday (TF - 1H)
R3 = 559.2
R2 = 558.20
R1 = 555.20
PIVOT = 531.70
S1 = 508.20
S2 = 484.20
S3 = 481.60
CROC X3 - Last Signal (Long Term - TF 1D)
LONG from 470.40
From 27/06/2017

WHEAT the rally continues The support at 508 is holding, i think now they try to test the pivot in area 532
WHEAT ZWU17 - Sep '17
CROC X1 - Supports / Resistances - Multiday (TF - 1H)
R3 = 559.2
R2 = 558.20
R1 = 555.20
PIVOT = 531.70
S1 = 508.20
S2 = 484.20
S3 = 481.60
CROC X3 - Last Signal (Long Term - TF 1D)
LONG from 470.40
from 27/06/2017

Start of a new long term bullish trend
Weekly:
- Massive bullish Kumo breakout with strong momentum, confirming the break of the 4 years bearish trend.
- irst weekly resistance and first bullish target is at 600
Daily:
- Bullish Ichimoku setup
- Bullish Heikin-Ash
- Any retest to 470-480 support zone would be a buying opportunity
