Will the Wheat futures (CBOT) form a Bullish pattern?Wheat futures (CBOT) is rebounding from the support level, and it seam a bullish pattern is being formed - Cup and Handle!
After complete formation of chart pattern, the target will be 760 US cent/bushel (23.4% increase from current level)
Indicator RSI is positive
ZW1! trade ideas

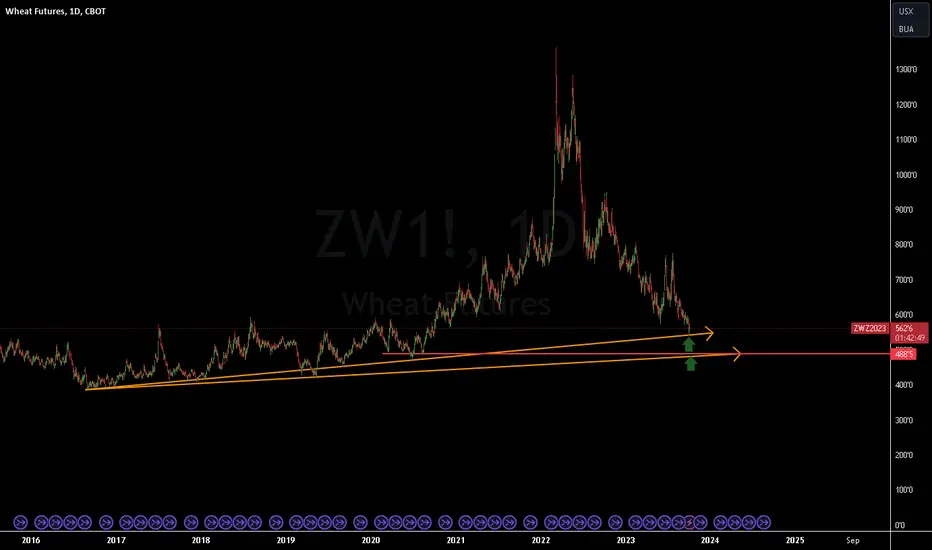
WHEAT Struggling on the 1D MA200. Long-term sell opportunity.Wheat (ZW1!) has been trading within a Channel Down pattern since July 2022 and since early December has failed repeatedly to detach itself above the 1D MA200 (orange trend-line). Since it is closer to the top (Lower Highs trend-line) of the pattern and it resembles the February 14 High, we expect a strong selling sequence if the price breaks below the 1D MA50 (blue trend-line).
The previous Lower Low was priced on the 1.786 Fibonacci extension from the Lower High. That gives us a projected target of 413'0.
-------------------------------------------------------------------------------
** Please LIKE 👍, FOLLOW ✅, SHARE 🙌 and COMMENT ✍ if you enjoy this idea! Also share your ideas and charts in the comments section below! This is best way to keep it relevant, support us, keep the content here free and allow the idea to reach as many people as possible. **
-------------------------------------------------------------------------------
💸💸💸💸💸💸
👇 👇 👇 👇 👇 👇

Two indications supporting long tradeOn the daily, the 20MA is about to cross up over the 100. This after bouncing off the .618 Fib as support. While commentary is mostly still at least slightly bearish on Wheat, or at least not bullish, due to ample supply, there are several obvious factors going forward that make continued record production uncertain. Furthermore, the real cost of producing wheat, such as loss of biodiversity, soil degradation and wheat's role as livestock feed and which will have to be accounted for one way or the other, makes this current price unrealistic.

Buy March wheat market on open, stop 6.14, tgt is 6.72Buy March wheat market on open, stop 6.14, tgt is 6.72


wheat carving out a traingle- e wave finishing up at 594=96wheat carving out the e wave of a terminating triangle .... lets see how play out as a low risk short is in play with a target of 5

Sell Dec. wheat at 5.45 stopsell Dec. wheat at 5.45 stop
**Trading commodity futures and options involves substantial risk of loss.
The recommendations contained in this letter is of opinion only and
does not guarantee any profits. These are risky markets and only
risk capital should be used. Past performance is not indicative of future results**
hypothetical performance results have many inherent limitations, some of which are described below. no representation is being made that any account will or is likely to achieve profits or losses similar to those shown. in fact, there are frequently sharp differences between hypothetical performance results and the actual results subsequently achieved by any particular trading program.
one of the limitations of hypothetical performance results is that they are generally prepared with the benefit of hindsight. in addition, hypothetical trading does no involve fina
ncial risk, and no hypothetical trading record can completely account for the impact of financial risk in actual trading. for example, the ability to withstand losses or to adhere to a particular trading program in spite of trading losses are material points which can also adversely affect actual trading results. there are numerous other factors related to the markets in general or to the implementation of any specific trading program which cannot be fully accounted for in the preparation of hypothetical performance results and all of which can adversely affect actual trading results.

Wheat target 955Wheat is forming a bottom , especially in daily a double bottom has already been formed , also a wedge formation is looking really good , waiting for bullish 2024 .

Short idea on the wheat marketMy current trade idea on the wheat mini futures to short given the strong bearish trend and a bear flag after buyers have failed to keep the buying momentum going even some fundamental issues putting pressure on the wheat market such as a surplus of wheat.
CBOT:ZW1! CBOT_MINI:XW1! AMEX:WEAT

hour ZWZ short below 570 SQ9Day view, hour frame.
Shorting below 570 SQ9 level, only after market open at 15h30 UTC+1 and if below 570 is confirmed.
Reasons:
- on a very wide view, d ZW1 Elliott master trend counting seems to be askng for new lows
back to today ZWZ hour frame:
- we are below Pivot level 579.50
- Yellow asc 1/1 as bull support brokne at friay open, confirmed so far with overnigth session
- Yellow desc 1/1 could be reached today after open at conjunction of other Gann line crosses and SQ9 level of 563.25 which is today conservative short target.
end session ends this proposed idea.

Chicago SRW Wheat Futures: Bullish reversal$ZW_F looks like a possible trend reversal in weekly scale, taking place after holding long term support from where the previous huge rally took off...
Certainly an interesting reward to risk vs probability of success here.
Your risk is a meager 88 ticks to make between 188 and 497 ticks if the setup works.
Best of luck!
Cheers,
Ivan Labrie.

forecasting, ZW/WHEAT , FUTURES in 15 min Hello to all investors, according to my previous studies and according to my experience as a trader, I see a good investment opportunity with a high probability of success, the details are reflected in the graph

Wheat Short4 hour TrendCloud Crossover
1 hour TrendCloud downtrend
30 min supply zone.
CCI is slightly against us but we are taking a 1% risk on this trade to the downside for a 2:1 target.


WHEAT - interesting situation- Wheat trades below the average price
- War in Ukraine doesn't help, though both sides sell at discounted prices
- Some bulls seem to wander around
- If price breaks up through 581, most likely we will see return to growth.

ZW1! Wheat LongWheat futures have broken out of a falling wedge pattern on positive divergence. The price broke out of the wedge to the upside, then it back-tested the wedge from above, and proceeded to move up aggressively today. This is an objective buy signal.
The most common investment vehicle for this trade is WEAT, an ETN backed by wheat futures.

Wheat price is about to fallWe think upheaval battle for high wheat prices has been lost and investors taking out their capital from long positions.


WHEAT Short From Resistance! Sell!
Hello,Traders!
WHEAT is retesting a broken
Key horizontal level of 580'0
Which is now a resistance
And as wheat is in the
Local downtrend I am
Bearish biased so I will
Be expecting a move down
Sell!
Like, comment and subscribe to help us grow!
Check out other forecasts below too!

wheatHi everybody I think you can long wheat little by little it is absorbing me .....
Gooooood Luuuuuuuck
Wheat Most Oversold in a Couple DecadesTime to look for an entry.
Apparently, I need to say more to publish this. Okay, good.

Wheat: Harvest time is coming soon! 🌾🚜The price of wheat is currently moving very much in line with our expectations and will soon reach our turquoise target zone between USX 560.60 and 531.10, where the low of the magenta wave (b) is expected. Then we should finally see a reversal and a broad-based rise to USX 807.25. Should the price fall below this zone, we would not change our scenario significantly, but would only expect a move further towards the magenta target zone.

Wheat Support And Resistance With Anchored VWAPIf I look at a bigger picture chart with a renko brick size of 20 on a daily chart on
ZW1! I am noticing we are at a key level of interest. We are at an area of potential support and if I use an anchored vwap starting as far as I can go back, we are sitting right on the volume weighted average price. Either we rally from here or we really breakdown to test those lower supports. Either way there is something here and I would wait for some sort of confirmation before jumping in.
