Wheat (World) - Short Bias; Cheap Ukrainian wheat everywhere!Sure, it is winter in the northern hemisphere so why even bother with the grains at all? ...
... Because cheap Ukrainian wheat had absolutely flooded European markets, so much so that very soon they will have to start dumping some of it into the ocean! (Right now, they are trying to air out these mountains of grain, so it wouldn't mold, but that will go only so far.)
Normally, this time of the year, 55-60 ships per week get loaded with Ukrainian wheat, headed for Africa and Asia.
As of last week, these numbers are down to 19 ships .
Russia closed the Bosporus to Ukrainian wheat (and oil seed) shipments.
As an alternative solution, Ukraine is shipping most of its harvest to the EU - mostly Poland & Germany - to load it on ships in those ports. - But guess what ...
... shipping it all to Europe AND THEN load it onto ships makes the whole proposition economically non-viable. (Well below producer cost.)
So now, the endless trainloads of grains, continuously pouring into the EU, gets dumped all over EU markets (at 40%-60% discounts!) because long empty local silos are all filled to capacity. There is now zero (0) storage capacity left anywhere in Europe! (... and the endless trainloads just keep on coming.)
... making this trade - not a monster - rather a no-brainer. (Like free beer)
ZW1! trade ideas

Sell wheat everyday 🐻🍞Who sells wheat everyday? It’s the price-reducing wheat bears who want to provide us all with a cheap basic supply of food. "Affordable wheat for all," chant they, offering reduced-price bushels of wheat to anyone who comes their way. At the moment, they are not to be restrained in their sell-off ecstasy, however, we already see the low of the blue wave (v) lying shortly before us, which means that this sell-off should soon come to its end. The wheat price is already in our green target zone here (between USX 662 and USX 472), where we expect a trend reversal. The bulls should therefore report back before too long and point to the need for higher wheat prices. It should be noted that with the end of said blue (v) wave, an overarching and relatively long-lasting correction should also come to its end. Therefore, our green highlighted target zone can serve as an excellent entry opportunity for speculations on the long side.

Grain Strain: How Geopolitical Unrest Threatens Wheat Prices AmiOpinion:
The recent escalation in the Russia-Ukraine conflict, following the assassination attempt on the Russian president, has raised concerns about the potential impact on global wheat prices. This situation becomes even more significant if Russia decides to withdraw from its agreements with Ukraine. As major players in the global wheat market, Russia and Ukraine together account for about 29% of the world's wheat exports, with Russia being the largest exporter, contributing around 18.5% in 2020. Any disruptions in their wheat production or export capabilities can have substantial implications for international prices, particularly considering the inelastic demand for wheat.
Wheat, as a staple food for many populations, has an inelastic demand, meaning that changes in its price have a relatively small impact on the quantity demanded. Given this inelastic nature, disruptions in the wheat supply due to geopolitical issues may result in significant price fluctuations, as consumers' demand remains relatively constant despite price increases.
In the event of Russia's withdrawal from its agreements with Ukraine, several consequences could directly or indirectly affect global wheat prices:
Intensified conflict and regional instability may disrupt wheat production and transportation. According to the United Nations Food and Agriculture Organization (FAO), the conflict has already led to a 15-20% reduction in agricultural production in affected areas. Further escalation could exacerbate these issues, limiting wheat production and export capabilities for both countries. The resulting supply shortages could disproportionately affect wheat prices, given the inelastic demand.
Geopolitical uncertainties created by the conflict could lead to trade restrictions and sanctions. In the past, Western countries have imposed sanctions against Russia in response to its actions in Ukraine. For example, in 2014, the United States and the European Union imposed economic sanctions on Russia, which impacted various sectors, including agriculture. If the situation deteriorates, additional sanctions could limit Russia's ability to export wheat to certain markets, creating supply chain disruptions and increasing the volatility of wheat prices on the global market, even with the inelastic demand.
Potential impacts on wheat prices could prompt other major wheat producers to adjust their production levels in response to shifting global demand. For instance, countries like the United States, Canada, and Australia may increase domestic production or seek alternative sources to secure their wheat supplies. As of 2021, these countries collectively contributed around 30% of the world's wheat exports. Changes in their production strategies could further affect global wheat prices, especially considering the inelastic nature of wheat demand.
The heightened uncertainty due to the assassination attempt on the Russian president and the subsequent escalation of tensions between Russia and Ukraine could lead to increased speculation in the commodities market. In 2021, the Chicago Board of Trade (CBOT) wheat futures saw significant price fluctuations in response to changing geopolitical situations. Traders may continue to react to the heightened uncertainty by buying or selling wheat futures contracts, which can influence short-term price movements and contribute to market volatility, despite the inelastic demand.
In conclusion, the latest developments in the Russia-Ukraine conflict have the potential to significantly impact global wheat prices, particularly if Russia withdraws from its agreements with Ukraine. Consequences of such a decision could include disruptions to wheat production and transportation, trade restrictions and sanctions, adjustments in global wheat production, and increased market speculation. The inelastic nature of wheat demand could exacerbate these impacts, leading to considerable price fluctuations. To mitigate the potential effects of these developments on wheat prices, it is essential for governments, producers, and traders to closely monitor the situation and develop contingency plans to ensure the stability of wheat supplies and markets.
Notes on how I personally use my charts/NFA:
Each level L1-L3 and TP1-TP3 has a deployment percentage. The idea is to flag these levels so I can buy 11% at L1 , 28% at L2 and if L3 deploy 61% of assigned dry powder. The same in reverse goes for TP. TP1: 61%, TP2:28% and TP3:11%. If chart pivots between TP's, in-between or in Between Sell levels these percentages are still respected. I like to use the trading range to accumulate by using this tactic.
Just my personal way of using this. This is not intended or made to constitute any financial advice.
This is not intended or made to constitute any financial advice.
FED Macro Situation Consideration:
All TP's are drawn within the context of a return to FED neutral policy. I do not expect these levels to be reached before tightening is over.
NOT INVESTMENT ADVICE
I am not a financial advisor.
The Content in this TradingView Idea is for informational purposes only, you should not construe any such information or other material as legal, tax, investment, financial, or other advice. Nothing contained within this idea constitutes a solicitation, recommendation, endorsement, or offer to buy or sell any securities or other financial instruments in this or in in any other jurisdiction in which such solicitation or offer would be unlawful under the securities laws of such jurisdiction.
All Content on this idea post is information of a general nature and does not address the circumstances of any particular individual or entity. Nothing in the idea/post constitutes professional and/or financial advice, nor does any information on the idea/post constitute a comprehensive or complete statement of the matters discussed or the law relating thereto. You alone assume the sole responsibility of evaluating the merits and risks associated with the use of any information or other Content on the idea/post before making any decisions based on such information.

ZW Wheat futures at 1st yearly supportJuly Wheat futures is testing support at the Yearly s1 pivot points.

Wheat ZW1!Mapping for wheat! Mapping for wheat!Mapping for wheat!Mapping for wheat!Mapping for wheat!Mapping for wheat!Mapping for wheat!Mapping for wheat!Mapping for wheat!Mapping for wheat!Mapping for wheat!Mapping for wheat!Mapping for wheat!Mapping for wheat!Mapping for wheat!Mapping for wheat!Mapping for wheat!Mapping for wheat!Mapping for wheat!Mapping for wheat!Mapping for wheat!Mapping for wheat!Mapping for wheat!Mapping for wheat!Mapping for wheat!Mapping for wheat!Mapping for wheat!Mapping for wheat!Mapping for wheat!Mapping for wheat!Mapping for wheat!Mapping for wheat!Mapping for wheat!Mapping for wheat!Mapping for wheat!Mapping for wheat!Mapping for wheat!

ZWN2023 - Artificial scarcity Wheat is getting cheapering
although it should go up in price because there's less of it on the market.
Prices in the stores are going up
How this happens, who can explain to me.
if you like the idea, please "Like" it. This is the best "Thanks!" for the author 😊 P.S. Always do your own analysis before a trade. Put a stop loss. Fix profits in installments. Withdraw profits in fiat and please yourself and your friends.

WHEAT FUTURES Weekly Technical AnalysisZW1! Weekly - No RECOMMENDATION or ADVICE Status / EDUCATIONAL only - Support, Resistance, Trend Lines, Cluster, Confluence, Rectangles, Pitchfork, Modified Schiff Pitchfork, Fibonacci Extension - Hope it Helps, Good Luck
DISCLAIMER - This communication is not trading or investment advice, recommendation or solicitation to buy, sell or hold any investment product is provided for informational, educational and research purposes only. All illustrations, forecasts or hypothetical data are for illustrative purposes only. The author or persons involved in the conception, production and distribution of this material cannot be held responsible for transactions or any financial loss or damages resulting directly or indirectly from the use or application of any concepts or information contained in or derived from this material. Past performance is not indicative of future results. Any person who chooses to use this information as a basis for their trading assumes all the liability and risk for themselves.

long position on ZWMy strategy is based on price action with the reading of certain indicators that I like while respecting all the values that define the stock maket

long position on ZWMy strategy is based on price action with the reading of certain indicators that I like while respecting all the values that define the stock maket

short position on ZWMy strategy is based on price action with the reading of certain indicators that I like while respecting all the values that define the stock maket

wheat futures look bullish for a new set up. $zw1bull case for wheat set up, if history repeats we get a nice curve to a pump.

2hr Wheat FuturesWheat Futures for the next bight- 2 hour chart---
Trying to adjust the market a certain way; over the next 2 years---
we will see what happens over; next 6 months

Wheat 609 Days from 609 low in July 2021Wheat 609 Days from 609 low in July 2021, did it square out for a run up?


Opening (Margin): /ZW April 21st 725/735 Long Call Vertical... for a 4.25 debit.
Comments: Taking a small directional shot in wheat here on weakness with a bullish assumption long call vertical. $287.50 max on buying power of $212.50 with a 729.25 break even.

What commodities will move in the 2nd year Russia-Ukraine War Russia-Ukraine War entered the second year. Most of the commodities skyrocketed after the invasion had returned to or below the pre-war level. Energy is the market focus but the price dropped below the pre-war level and might not have enough geopolitical moment to rebound unless the war fully escalates and spreads to other countries. The weakness of wheat price might reverse if Russia refuse to renew the export deal.
Energy products are the main focus in this war since Russia is the world’s key energy exporter. NYMEX WTI crude oil price started from USD92.10 as of the close of 23 Feb 2022, and reached an intraday high of USD130.5 per barrel in March. NYMEX Natural gas is even more volatile, jumped from USD4.623 per MMBtu to reach over USD10 in August. However, despite the sanction and price cap imposed by western countries, the energy exports from Russia maintained at high level, and European winter weather is relatively mild together with the effort to secure supply from non-Russia energy sources, the supply and demand situation is much less bad than many had feared, and the energy price retreated significantly and dropped below pre-war level. As of 24 Feb 2023, NYMEX Natural gas closed at USD2.548, while NYMEX WTI crude oil closed at USD76.32.
Assuming the war are restricted in Ukraine and haven’t spread to other European countries, the war will no longer have a material impact on energy price. Western countries don’t want to shut down Russia’s energy supply completely, they just don’t want Russia to make a lot of money from energy exports to finance the war. The ideal situation is Russia selling cheap oil and gas to global market. In fact, Russia is still exporting a lot of their energy products to China and India, and the reduced demand from them in the global market pressured the price. I can’t predict the outcome of a war, but a win by Ukraine might further pressure the energy price since Russia might probably need to aggressively sell their energy for war compensation and rebuilding the country. Even the war maintains the status quo for an extended period of time, it will not stimulus the energy price like last year since many countries had already reduced the reliance on Russia’s energy.
What I worry more is grain price. Russia and Ukraine together are supplying one third of global wheat. Many of the Ukrainian grain planted in the Southern and Central part of the country, that had been seriously affected by war. Ukrainian grain exports dropped nearly 30% in the last marketing year. Not only the plantation area will be affected, all the input including labour, fertilizer and chemical supply are also affected, not to mention the harvest and the logistic to export the grain. Grain export deal with Russia is expiring on 19 March, whether Russia will renew it could be a catalyst for market movement, and the lower price of Ukrainian grain because of this uncertainty might also reduce farmer’s willingness to plant wheat.
Russian grain production hasn’t been affected yet; in fact, the harvest of wheat is pretty good. When energy crisis didn’t realize, whether Russia will weaponize grain will need further monitor. At this moment, grain export is not targeted by western countries, so Russia might try to export as many grains as possible to improve their financial situation, but if the war situation turned sour, I can’t rule out the possibility of some form of export ban which might make the inflation situation in western countries more complicated.
CBOT wheat price started from USX 884.75 as of the close of Feb 23, and reached an intraday high of USX 1363.5 per bushel in March. As of 24 Feb 2023, it closed at USX 721.75. Of course, the weakness could also be explained by bumper crop from Australia and an expected high US production in the coming year. Technically USX 712.5 is an important support, and RSI is approaching oversold level. We might consider a long position @ 715, stop loss @ 680, target @ 800.
Disclaimers
Above information are for illustration only and there is no guarantee on the accuracy of the information. They should not be treated as investment recommendations or advices.
CME Real-time Market Data help identify trade set-ups and express my market views. If you have futures in your trading portfolio, check out on CME Group data plans in TradingView that suit your trading needs www.tradingview.com

Fundamentals favour soybean, sugar and wheatAgricultural commodities, led by grains rose sharply in 2022. The two main catalysts for the upside in price were the Russia-Ukraine war alongside other supply challenges. There has been a number of cascading events around these two catalysts involving government interventions globally as food prices soared.
However, from mid-October the renewal of the Black Sea grain initiative for six months, helped quell concerns of access to Black Sea ports. We have seen prices decline since then, but from a high level.
It’s worth noting that grain exports from Ukraine under the Black Sea Grain Initiative dropped to 3.1mn tons in January compared to 3.6mn tons in December 2022 owing to a slowdown in inspections1. In 2023, the supply demand balance appears to be favouring soybeans, wheat, and sugar.
Extreme drought in Argentina lends a tailwind to soybean prices
In the case of soybean, a gloomier supply outlook has been a key tailwind for prices in 2023. Argentina, the world’s third largest soybean producer, is expected to see a weaker crop at 35.5mn tons owing to persistent drought and high temperatures. The Foreign Agricultural Service of the US Department of Agriculture (USDA) estimates the crop at just 36mn tons after the USDA previously predicted a crop of 45.5mn tons.
However, both estimates are still well above the assessments of local experts. The Rosario Grain Exchange, which asserts the drought is the worst in 60 years, lowered its soybean forecast to 34.5mn tons. Thus, future downward revisions by USDA are quite likely which should help soybeans continue to find support.
Net speculative positioning in soybean futures has increased 124% since the start of October underscoring the positive sentiment owing to the tighter supply outlook.
Tighter supply on the global sugar market
Sugar prices are trading at a six year high. Investors remain concerned over the prospects of the sugar crop in India, the world’s second largest sugar exporter. Sugar cane processing in Maharashtra, the most important growing State, could end 45 to 60 days earlier than last year owing to heavy rainfall that has reduced the availability of sugar cane.
In 2022, sugar production reached a record 13.7mn tons, which allowed India to export a record high 11.2mn tons of sugar.2 The Indian Sugar mills Association (ISMA) revised its estimate for domestic sugar production lower from 36.5mn tons to 34mn tons for the 2022/23 season2. This is raising concerns that the Indian government will not approve any further sugar exports for the current marketing year owing to the recent reports of weak production.
This does suggest a tighter global sugar market particularly as we are in the midst of Brazil’s (the world’s largest sugar producer) sugarcane off-season. Although Brazil produces sugar all year round, during this period (December to March) few mills continue to crush. Supply from Thailand, the world’s third largest sugar producer is unlikely to fill the gap left behind by the smaller Indian harvest particularly during Brazil’s off-crop.
The front end of the sugar futures curve has been in backwardation over the past 3 months and currently provides a roll yield of 7.2% highlighting the tightness in the sugar market.
Wheat most exposed to geopolitical tensions
Wheat prices have under most pressure from the improved supply prospects from the Black Sea Region. However total grain exports have declined by 29% to 27.7mn tons in the ongoing season (from 1 July 2022 to 31 January 2023), with wheat exports down 42% over the prior year.3 The ongoing escalation in the Russia Ukraine war continue to threaten supply from the breadbasket of Europe.
The US Department of Agriculture is forecasting a noticeably smaller Russian wheat crop of 91 million tons for 2022 in sharp contrast to Russia’s State Statistics Agency estimate at a record high of 104.4mn tons. According to the consultant firm SovEcon, the key growing region in the south of Russia has seen only around 40-80% of its normal rainfall over the past three months. The forecasts of this year’s crop in Russia are less optimistic. In the 2022/23 season, a record crop in Russia enabled ample supply of the wheat markets, despite a considerably lower crop in war-torn Ukraine in particular, thereby dampening prices.
Lower supply is likely in the coming season, however, not only from the top wheat producers – Russia and the US – but also from Ukraine on account of the ongoing military conflict. The Ukrainian Grain Association (UGA) anticipates a crop volume of 16 million tons. According to the Ukrainian Agriculture Ministry, 20 million tons of wheat were harvested last year. Before the war, the crop had totalled around 30 million tons.
Net speculative positioning in wheat futures is currently more than 2-standard deviations below its five-year average, underscoring the extreme bearishness on the wheat market.
Amidst the ongoing conflict and lower wheat supply from Russia and Ukraine, wheat prices appear positioned for a rebound from current levels.
Sources
1 Bloomberg as of 31 January 2023
2 Indian Sugar Mills Association as of 30 December 2022
3 Bloomberg as of 31 December 2022

May Wheat futures: Daily trend reversalThis setup can lead to a larger failure of a weekly decline signal, which could cause a major move in $ZW_F. I'm long May futures here, paying close attention to how it develops, if the signal isn't stopped the trade could be held for longer until the chart evolves into a higher timeframe trend potentially, that would be the ideal scenario here.
Best of luck!
Cheers,
Ivan Labrie.

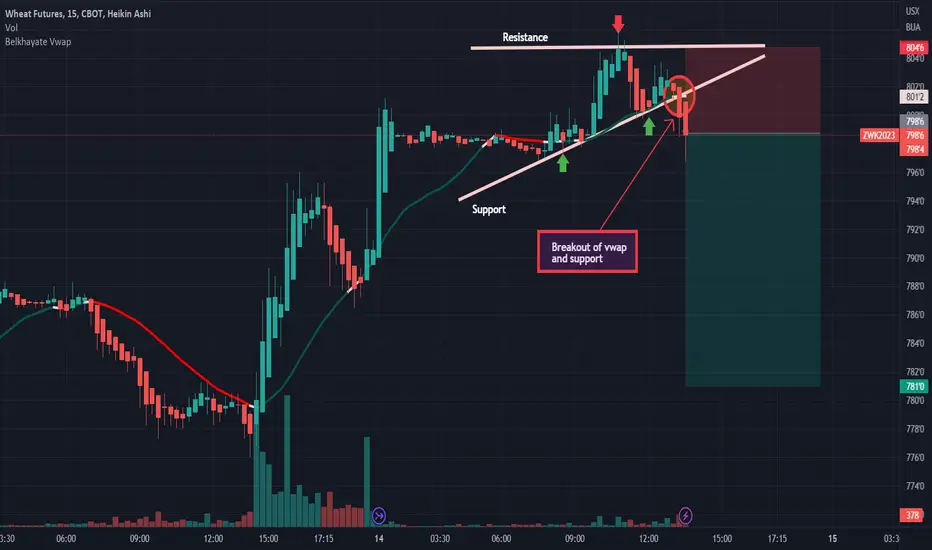
WHEAT BULLISH SCENARIOWHEAT agriculture commodity will always be one of the most significant for the survival of the human race. Production, export, and import have been under heavy hits for the past 3 years, especially the past 11 months during the invasion of Ukraine. Ukraine is a major producer and exporter, as we follow the conflict we can easily determine that plays a significant factor in price speculations and it has been very fruitful for day threaders and short-term traders. On the 1hr chart, we can study 2 findings, resistance level at 800' an uptrend channel with a 50$-60$ volatility range. Bulls can pursue reaching that resistance and hope for a break.
Risk Disclosure: Trading Foreign Exchange (Forex) and Contracts of Difference (CFD's) carries a high level of risk. By registering and signing up, any client affirms their understanding of their own personal accountability for all transactions performed within their account and recognizes the risks associated with trading on such markets and on such sites. Furthermore, one understands that the company carries zero influence over transactions, markets, and trading signals, therefore, cannot be held liable nor guarantee any profits or losses.

Wheat Addressing Momentum DivergenceIn this update we review the recent price action in the Wheat futures contract and identify the next high probability trading pattern and price objectives to target

Drought, war, oil price, inflation (despite recession) -price upHello,
We have a lot of factors to push price of WHEAT to next level.
1. Drought in USA (2023). It can affected results of harvest in this year.
2. War in Ukraine and "super danger" aggressions from Russia (both economics will be damaged - for agriculture).
3. Also we are expecting that the Price of Oil (Brand) will grow up from 85$ to 115$ (November 2023). Hello, Mr. Buffett!
4. New War of FED with inflation can be additional trigger for commodities and food .
God bless your investments and your families!

Wheat Futures 1W short targetThe signals in the chart point towards a likely continuation of the recent drop with a short target at around $560.
