KC - The Uprising signalA volatile Tendance of the KC, shows positive potentiel towards uprising level first pick at 474 USX. The next step shall provide more certainty.
MKC1! trade ideas


WHEAT FUTURES (KE1!) MonthlyThe Djinn Predictive Indicators are simple mathematical equations. Once an equation is given to Siri the algorithm provides the future price swing date. Djinn Indicators work on all charts, for any asset category and in all time frames. Occasionally a Djinn Predictive Indicator will miss its prediction date by one candlestick .
Dates in the future with the greatest probability for a price high or price low.

WHEAT FUTURES (KE1!) WeeklyThe Djinn Predictive Indicators are simple mathematical equations. Once an equation is given to Siri the algorithm provides the future price swing date. Djinn Indicators work on all charts, for any asset category and in all time frames. Occasionally a Djinn Predictive Indicator will miss its prediction date by one candlestick .
Dates in the future with the greatest probability for a price high or price low.

WHEAT FUTURES (KE1!) DailyThe Djinn Predictive Indicators are simple mathematical equations. Once an equation is given to Siri the algorithm provides the future price swing date. Djinn Indicators work on all charts, for any asset category and in all time frames. Occasionally a Djinn Predictive Indicator will miss its prediction date by one candlestick .
Dates in the future with the greatest probability for a price high or price low.

Kansas Cory Wheat Short Opportunity Off Of HighsLooking at a short opportunity with KC Wheat being at highs of 500’s I also look for other conditions.
1- divergence on almost all Macro time frames including the daily , and indecision here on monthly and weekly timeframes.
2-seasonal historic patterns showing a time where commercials can flip position to net buyers meaning they are hedging against the speculators that can drive prices back down
3-momentum looks weak up there
Let’s see what happens all I am short one calendar spread from here. Good luck !

Hard Red Winter Wheat: Sell Opportunity on the 1W Resistance.The price is testing the 499'4 1W Resistance after a prolonged rise since the rebound on the 380'4 1W Support. We've made a Double Top on the 1D chart which remains bullish (RSI = 65.798, MACD = 12.030, ADX = 55.290, Highs/Lows = 2.8750). However MACD is forming a top on a bearish reversal pattern. We are expecting a strong rejection after that Double Top and our Target Zone is 393'2 - 380'4.
** If you like our free content follow our profile (www.tradingview.com) to get more daily ideas. **
Comments and likes are greatly appreciated.

Buy July 20 Wheat KBCT (KE) and Sell July 20 Wheat CBOT (ZW) Buy July 20 Wheat KBCT (KE) and Sell July 20 Wheat CBOT (ZW) against it
Close around January 20th

KEN2020-KEK2020 - Commodity Spread on Coffee FuturesKEN2020-KEK2020
Rising triangle in formation on this spread between two wheat futures contracts.
Statistically, in the previous 15 years of our seasonal window we have come to profit in 100% of cases with an average risk reward of 3:1.
With this strategy we started trading years ago, bringing us considerable profits that made us understand that operating in the financial markets was an incredible potential source of income if done with professionalism and discipline.

Hard Red Winter Wheat: Medium term Sideways Signal.Hard Red Winter Wheat is trading within a Descending Triangle on 1M (RSI = 40.777, MACD = -11.870, Highs/Lows = -63.0357). This month has rebounded on the 382 1W Support marking the 3rd time it bounced on that level since May, practically making a technical Triple Bottom.
As seen on the chart it appears to be replicating the July 2018 - January 2019 pattern, when then price after a Lower High within the 1M Descending Triangle, it declined and consolidated before eventually making the bottom on the 382 1W Support.
As a result we have calculated a trading range within 382 - 417 that may last until late November. This can be a very profitable medium term scalp opportunity.
** If you like our free content follow our profile (www.tradingview.com) to get more daily ideas. **
Comments and likes are greatly appreciated.

Hard Red Winter Wheat: Ascending Triangle. Lower buy opportunityThe price is trading on an irregular 1D Ascending Triangle (RSI = 55.404, MACD = 3.560, Highs/Lows = 0.0000). The supporting lines give an optimal long entry close to 500. TP = 517.
** If you like our free content follow our profile (www.tradingview.com) to get more daily ideas. **
Comments and likes are greatly appreciated.

KE1!: Both targets hit. Long on the 1W support.Both TP =574.20 & 588.20 hit as the 1W Channel Up (MACD = 9.620, B/BP = 0.3280) made a 598.40 Higher High. It has since pulled back to make a Higher Low, which was most likely priced at 498.20. This commodity (Hard Red Winter Wheat) is on a very long term uptrend and we are now holding a long with TP = 569, 598 in extension.

1W Rectangle. Support tested. Long.The Hard Red Winter Wheat is trading sideways within a long term 1W Rectangle (RSI = 51.682, Williams = -53.356, CCI = 24.4952, Highs/Lows = 0.0000) and the High Volatility (ATR = 43.4643) sustains this movement. After a successful support test, we are long with TP = 562.60.

Sell Wheat Futures @ 578'2Potential trend change in wheat. Enter sell @ 578'2
I would enter with one contract now and wait for MACD confirmation before putting more on.

Kansas wheat long term up, short term down.There is a good scalp opportunity for Kansas wheat futures. Showing a shooting start, obviously needs conformation, however its on a downward momentum for a short term shorting opportunity but the long term trend is going up!

KE1! @ daily @ inside bullish 200&100MA with a triangle outbreakTake care
& analyzed it again
- it`s always your decision ...
(for a bigger picture zoom the chart)
This is only a trading capability - no recommendation !!!
Buying/Selling or even only watching is always your own responsibility ...
44 COMMODITIES of Chicago, New York & londo (MA 100 & 200 inside bearish) @ drive.google.com
Best regards
Aaron

KC Sept Wheat LongThe market completed a valid double bottom last week at the $4.00 level as this is an "emotional" number in the market. First area of resistance is going to be around the $4.30 range, and if we can close about that level I would imagine the market will make a run back into the $4.60 which is our next area of resistance. Let me know your thoughts.

Sep KC Wheat LongThe market is drastically oversold as we are right in the middle of wheat harvest in Kansas. I would expect to see a rally here back up into the $4.50's - $4.70's as that is a prior area of support/resistance and a 61.8 Fib Retracement. This would be a good place for farmers to look to sell or forward contract some more grain.

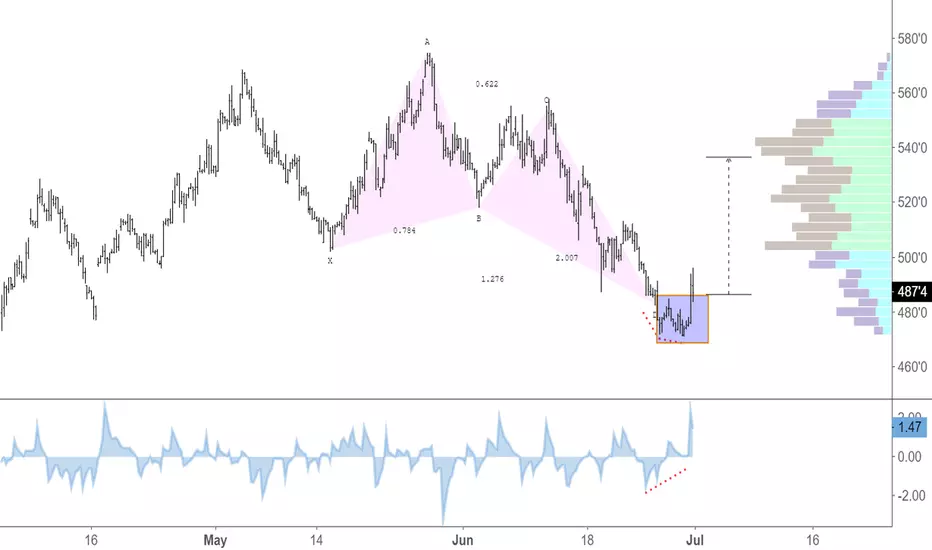
July KC Wheat LongThe market has made a new structure low and has become extremely oversold at this current level. Using Fib Extensions and Inversions I was able to draw a box between the 141 Extension and the 161.8 Inversion as a potential buying zone. If we can get some buyers I would see prices rallying back into the $4.40's to $4.50's range before potentially continuing a downtrend. However, the overall emotion of the market could continue taking us lower and there is no point in trying to catch a falling knife. Poor Farmers.

July KC Wheat ShortThe market has made a new structure low on the daily timeframe. We had a bounce in price yesterday and I am predicting a retest of the $4.70's area which is a good area of prior support/resistance and would be 61.8 - 78.6 retracement. I only look at the Daily Time Frame for Grain and Cattle Commodities.
