Dow Jones technical analysisI predict the Dow Jones will continue to rise. I don't expect any market crash until 2025. According to my analysis, it will cross 40K next year.
MYM1! trade ideas

YM (Dow) UpdateI don't usually look at the Dow, but you can see that it has clearly broken the year long down channel.
That is bullish for the other indices.

Dow 1hour say: 35000 is upper target as I predict yesterday dow go down
if you have old sells, close all above fibo61%
We must buy above green arrow after pinbar comes , try hold it to new high ,filo 161%
BE CAREFULL FROM SELL, END OF YEAR +RALLY CAN START
wish you win

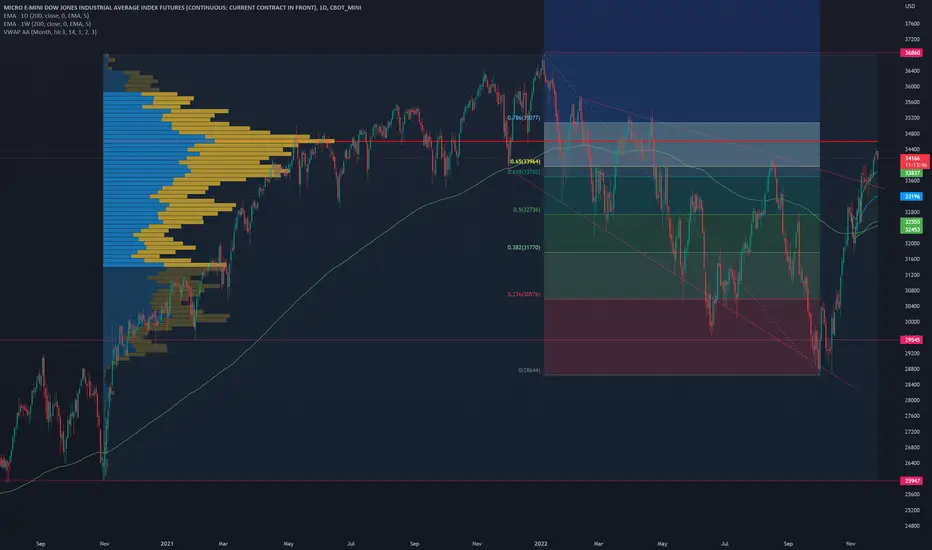
Dow mini futures - volume resistance aboveOne of the best preforming parts of the stock market in recent weeks has been the Dow Jones Industrial average. On this mini futures chart I can see that this could be the time where we see a serious pull back because there is a high volume zone right above where we are now.


US30USD YM1! DOW 2022 NOV 28
US30USD YM1! DOW 2022 NOV 28
Scenario1 continuation long was in place from Nov 07's analysis.
Weakness are appearing on all timeframes. Tighten stops on
long positions. Volume was thin due to US holidays. Expected
to remain thin as year end approaches.
Possible scenarios:
1) Temporary short if 34246-33800 is rejected
2) Stay out of market since volume is thin
3) Continuation long if 34246-33800 is supported
Price reaction levels
Short on Test and Reject | Long on Test and Accept
35750 35330 34246-33800
33106 31793
30513 28635
Weekly: ND on uptrend = minor weakenss
Daily: Declining volume + narrow spreads = weakness
H4: Supply observed
Remember to like and follow if you find this useful.
Have a profitable week ahead.

Dow Jones E-mini Futures – Stage 2 Breakout AttemptThe Dow Jones is making it's first Stage 2 breakout of 2022, with the Stage Analysis Technical Attributes (SATA) indicator on a SATA score of 10 of 10, which is the highest score since May 2021.

DowJones Trading The Ending DiagonalIn this update we review the recent price action in the emini DowJones futures contract and identify the next high probability trading opportunities and price objectives to target

Dow Jones Bear Case.gm,
---
The highest request over the last few weeks = "elo, what's your bear case on the stonk market?".
Well, you guys asked for it...
So I'm here to give you just that.
A face ripping,
soul crushing,
heart wrenching dip;
which takes the average american's 401k,
and turns it into a 201k.
---
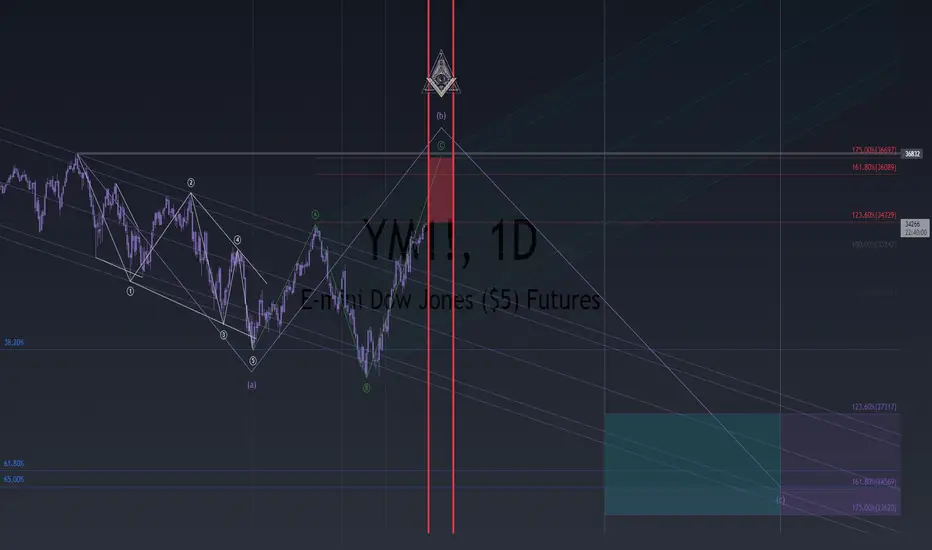
Tuesday November 29th 2022 ~ December 21st 2022 = my calculated top.
Estimated to sit between 34,329 ~ 36,697.
.
---
Friday May 12th 2023 ~ Tuesday October 24th = my calculated bottom.
Estimated to sit between 27,317 ~ 23,620
.
---
🔺
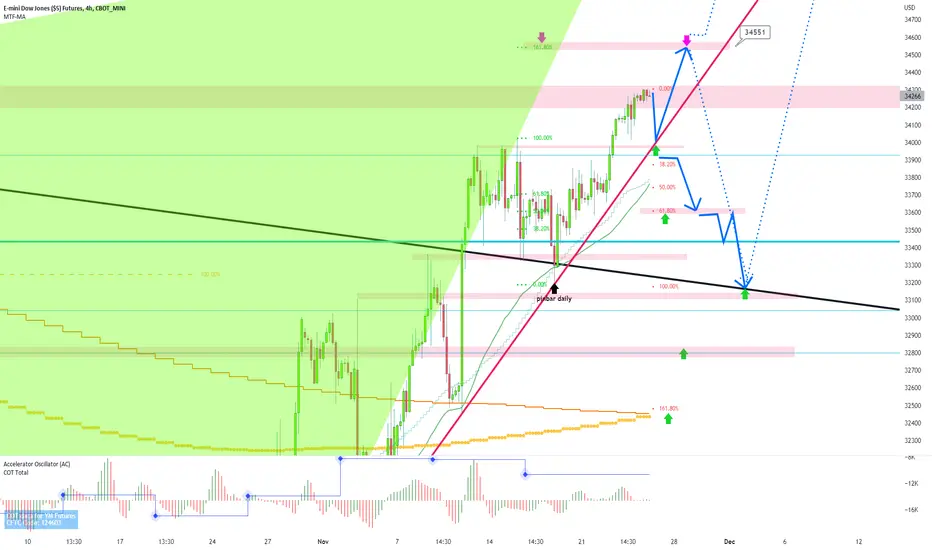
dowjones 4hour : all scenario on dow 1-70% go down and touch support and go up to fibo161
2-30% go down break support and go downer
above green arrow after pinbar come on 1hour or 4hour or daily chart we must buy Sl: pinbar low and hold to new high ok?
if you have old sell,you must close all or hedge them in fibo50 33760-33770...dont forget dow,index, dax sp500 and gold love buy and uptrend so sell on them is very very dangerous..check weekly chart exactly
note: as predict 10 days ago in low dow can go to 35000 even 3600 so be careful from sell and 90% looking for buy
ALERT: END OF YEAR UP TREND RALLY ON INDEX LIKE DAX NASDAQ SP500 AND DOW CAN START
good luck
dow 4 hour : it can go down now technical say dow can see fibo50 or fibo61 is best place for buy after pinbar come on 1hour or 4hour or daily chart
if you have old sell close all above green arrow ,,,dow main trend will +up to 35000
goodluck

Dow Jones: Down UnderAfter moving sideways for a while, we're expecting Dow Jones to drop into the orange target zone between 32 762 and 31 980 points to complete wave iv in orange in order to push the trend back up to the orange target zone between 34 305 and 35 466 points. After managing to pull itself up there to compete wave (i) in blue, we expect the course to drop back South.
In our alternative scenario, Dow Jones can't turn the trend up this early and continues to drop below the support line at 31 738 points. After crossing this mark, the course should sink further into the blue zone between 31 331 and 29 789 points until wave alt. (iii) in blue hits its low before turning back up to move North. blue hits its low before turning back up to move North.

Is this rally a bear trap or a resuming bull? This is what we will be discussing today, and we are going to study both its technical and fundamental reasons and subsequently to derive why it is a bear trap? Or could it be a new bull in the making?
I hope this tutorial will be helpful, in enabling you to read into the market with greater clarity.
I have started a trading series, purpose for trading into longevity. Last week was on Buy Strategy, today on Sell Strategy. These strategies shared, they all can be applied to most markets and in different time frames.
Content:
a) The sell strategy – applicable to both:
· Long-term – Fundamental & Technical
· Short-term – Fundamental & Technical
b) Bull or Bear?
Some important dates:
14 Dec 21 - Fed: "Inflation no longer transitory"
10 Nov 22 – Oct CPI @ 7.7%, below expectation of 8.2%
Micro E-mini Dow Jones Futures
Minimum fluctuation
1 index point = $0.50
10 = $5
100 = $50
Of course if you need something more sizable, there is the E-mini Dow Jones Futures.
You can refer to the links below, you will find some of my past video tutorials, on how I time the different markets.
As time passes, you will see how nicely most markets trend along our analysis then.
Disclaimer:
• What presented here is not a recommendation, please consult your licensed broker.
• Our mission is to create lateral thinking skills for every investor and trader, knowing when to take a calculated risk with market uncertainty and a bolder risk when opportunity arises.
CME Real-time Market Data help identify trading set-ups in real-time and express my market views. If you have futures in your trading portfolio, you can check out on CME Group data plans available that suit your trading needs www.tradingview.com

DJI futures long by Cosmic GravityPredicting a substantial 5.7% rise as price consolidates inside the Cosmic Gravity] resistance channel. Take profit is set at "R6 line" and stop loss slightly below the resistance channel.

DOWJONES 4hour : be careful from sell , upper target is 360002 scenario on dow possible
1- if it can break high door will open to 36000
2-in bad scenario with bad news it can go down to fibo50 then start wave2 of uptrend WE MUST BUY IT ABOVE GREEN ARROW AFTER PINBAR APPEAR IN 1HOUR,4HOUR,DAILY CHART and hold it 7-8 day to 36000 area
if you have old sell, close them soon as soon or hedge them with higher size: 1.5*total sell size
ALERT : NEW YEAR WILD RALLY CAN START SO DONT PICK SELL ,LOOKING FOR BUY dont forget like gold DOW love buy and upside trend
good luck


Trading Series – The Buy StrategyI am starting a new Trading Series, the whole idea is to create longevity in our trading career, meaning trading should not be a short-live adventure, but we should trade till right into our retirement age.
We all may have read that many build-up their fortunes through business, investing or even trading and suddenly most of their net worth reduced substantially overnight, and this is what I mean they are running it without longevity.
Trading is a very fulfilling job and can be non-stressful when we understanding there is a framework to recognise opportunity and risk from the markets. Our role in this job is to eyeball both that trading opportunities and risks and then make decisions from there whenever we identify either one of them.
I am going to share with you my experience on how to do that in this whole series – Today we will discuss The Buy Strategy, in the next part, we will discuss the sell strategy. And the subsequent parts on the different strategies and how to manage our trades and trading fund into longevity.
Content:
The buy strategy – it can be applied to both:
· Long-term
· Short-term
Minimum fluctuation
1 index point = $5
10 = $50
100 = $500
There is the micro as well. It is one tenth the size of the E-mini. Very manageable especially for those aspiring traders.
Disclaimer:
• What presented here is not a recommendation, please consult your licensed broker.
• Our mission is to create lateral thinking skills for every investor and trader, knowing when to take a calculated risk with market uncertainty and a bolder risk when opportunity arises.
CME Real-time Market Data help identify trading set-ups in real-time and express my market views. If you have futures in your trading portfolio, you can check out on CME Group data plans available that suit your trading needs www.tradingview.com

DOW 4hour : year end rally can start, dow can go up to 36000strongly advice dont pick sell, looking for buy signal and buy pinbar for hold to new high
if you have old sell you must close all near 33000
good luck

DowJones 33800 Target Achieved, New Pattern EmergingTechnical & Trade View
Dow Jones (emini futures contract)
33800 Target Achieved, New Pattern Emerging
Bias: Bullish Above Bearish below 33600
Technicals
Primary support is 33360
Primary pattern objective is 34400
Acceptance above 34000 next pattern confirmation
Acceptance below 33100 opens a test of 32900
20 Day VWAP bullish , 5 Day VWAP bullish


dow bonesgood afternoon.
---
pretty sweet deadcat bounce on the dow,
but every bear bounce eventually comes to an end.
the end is near for the down bones, and i felt like letting you know about it today.
---
tread carefully in the months ahead, and be ready for a 20%+ decline in the broad markets.

dow 4 hour : are you ready for sell ?wait pinbar come on 1hour or 4hour or daily candel then sell with sl on pinbar high
good luck
