Markets Goal is 2018 Yearly Open and Covid Peak Formation Low The market's goal is to return to the Covid peak formation low, the 2018 yearly open and the middle of the 2018 range. Along the way, all the lows will be taken to achieve this goal.
Middle of Range:
COVID Peak Formation Low:
Returning to 2018 Open:
It is very clear to me now that this is the gameplan. I will remain a bear until the 2018 Yearly Open price of 27,500. This is a 40% retracement. My only concern is I don't know HOW price will arrive there and when. That is the challenging aspect of it. I AM 100% confident that 27,500 is the goal.
Looking at April 7th's lows, these are so very obvious that these will get dunked on and eliminated soon.
MYM1! trade ideas

Party's OverDow Futures daily forming a downwards channel with price targets potentially down to 34k and 31k. These drops would be about 20-40% which is considered a true market crash. The falling wedge pattern plays out until potentially June of 2027, but wedges from the top of the range are dangerous as they can turn into bull traps.
- Economic fundamentals have been disconnected from the financial system for some time but as the underlying economy begins to falter (ex. unemployment wave) markets begin to price in data such as falling retail sales.
- President Trump is going through with mass layoffs in the Federal Government which creates unemployment as the private sector has been going through layoffs and has halted actual new hiring since 2023.
- As more traders have become accustomed to "bad news is good news," they will most likely be wiped out trying to buy dips or chase false breakouts doing what they have always done.
- Tariffs regionalize trade which make global economies and supply chains less interconnected. A global economy that is also very levered up on USD denominated debt needs dollar liquidity to continue to function. By regionalizing trade that liquidity is starved which can lead to financial problems on a global scale if not handled carefully.
- Markets are likely to price in these risks over the next 2-3 months leading asset prices and interest rates lower. Expect individual companies to do well at times but then rotate to others while the Dow index itself falls.
- Even if the Dow were to play out the wedge during 2026, without significant improvements to the global financial system expect that move to be a bull trap or a best lead to minimal gains without a new wave of monetary inflation.

Strategic Short Opportunity for Dow Jones Amid Volatility
- Key Insights: Given the recent market volatility, the Dow Jones appears poised
for short-term declines. The escalation of global economic uncertainties,
particularly surrounding tariffs and bond yields, suggests a challenging
environment for the index. With the Dow Jones down by 7.9%, it mirrors
broader market pressures, making a strategic short position potentially
advantageous for the coming week.
- Price Targets:
- Next week targets (T1, T2): 35,500, 34,800
- Stop levels (S1, S2): 39,000, 40,500
- Recent Performance: The Dow Jones experienced a significant downturn of
approximately 7.9% recently, reflecting widespread market pressures. This
decline aligns with similar movements in the NASDAQ and S&P 500, which fell
by 10% and 9.1%, respectively. The heightened volatility has been a notable
characteristic of the financial markets, with investor concern evident.
- Expert Analysis: Analysts are expressing caution regarding a prolonged bearish
trend for the Dow Jones. Despite some discussions about short-term bullish
setups, the overarching sentiment highlights prudence due to external
stressors. Factors such as tariff concerns and global economic uncertainties
are central to this cautious outlook, further exacerbated by the Volatility
Index (VIX) reaching levels not seen since April 2020, highlighting market
anxiety.
- News Impact: Recent market turbulence stems from various factors including
tariff announcements and global economic slowdowns. Particularly impactful
is the yield on the 10-year Treasury note dipping below 4%, signaling a move
towards safer assets amidst uncertainty. Additionally, the drop in crude oil
prices into the lower 60s aligns with broader economic concerns, projecting
potential impacts on global growth. These elements combined with elevated
volatility signify a cautious investor sentiment and a market under stress.

MYM Daily Swing TradeArrows show possbile pattern candle can make
Entry will be at the break and retest of trendline or wait to confirm
bounce of the trendline.

How to Identify Double Top Formation - A Long-Haul Bear?How to identify double top formation?
Is the US market still forming this double top formation, or has the pattern already completed, signaling a deeper correction to come?
In this discussion, we will focus on the latter question: whether this bear is going to be a long-haul bear.
3 parts of today tutorial:
1. How to Identify Double Top Formation is completed technically?
2. How to cross reference to its related markets?
3. How do the fundamental developments confirm these technical studies?
E-mini Dow Jones Index Futures & Options
Ticker: YM
Minimum fluctuation:
1.00 index point = $5.00
Micro E-mini Dow Jones Index Futures
Ticker: MYM
Minimum fluctuation:
1.0 index points = $0.50
Disclaimer:
• What presented here is not a recommendation, please consult your licensed broker.
• Our mission is to create lateral thinking skills for every investor and trader, knowing when to take a calculated risk with market uncertainty and a bolder risk when opportunity arises.
CME Real-time Market Data help identify trading set-ups in real-time and express my market views. If you have futures in your trading portfolio, you can check out on CME Group data plans available that suit your trading needs www.tradingview.com
Trading the Micro: www.cmegroup.com

April NFP Pump and DumpI am looking for a false break reversal after no follow through of a bullish bar. I will enter on the close of the bear candle that takes out the high bull. Trend is bearish until 30,000


YM / Dow Jones - long term perspectiveOn the CBOT_MINI:YM1! weekly/monthly/quarterly chart, nothing is looking out of the ordinary as of right now.
No matter what timeframe you're looking at, all timeframes have to go through cycles of rise and fall, and this current panic is just a normal red candle on the quarterly/monthly charts.
After this monthly/quarterly pullback, I'm still expecting a push higher to reach at least 48k before any longer term weakness should set in, if at all.
I see $34k-$38k as a mid-term discount zone, with 42-48k as a mid-term premium zone, with 48k as a magnet of sorts for price to draw toward.
I have 2 scenarios I'm currently watching for:
MID-TERM PULLBACK: Bull market stays intact, Trump ISN'T actually Hitler :-), price sweeps under $38k and sets up bounce back toward 48k from there.
LONG-TERM PULLBACK: World falls apart, Trump IS actually Hitler :-), bear market commences, multiple quarterly red candles, price does a deep pullback to $27.5k before rebounding from there.
SCENARIO 1 (seems most likely):
SCENARIO 2 (seems very unlikely):
Mostly, I would just counsel people to have a plan. "If bull market stays intact, do XYZ. If bear market develops, do ABC."

Dow Jones 32% Correction Bearish Bias UpdatedI have been proved wrong about being bullish lately. I took a couple L's and had to step back. Using the monthly chart, I have marked in blue lines every year's open. I can see a clear support area at the 2020 yearly open. This will take out the lows of both 2022 and 2023 low.
I will be ignoring any bullish bars in anticipation of them getting eliminated.
Yes, the long-term trend is indeed bullish, and this 32% correction will be a counter trend to the current bull trend.
The 2020 open is EXACTLY 50% of the high/low
Market declines in %:
Bearish Setups to employ:
Moral of the story? Don't pay attention to bullish bars as they will soon be wiped away.

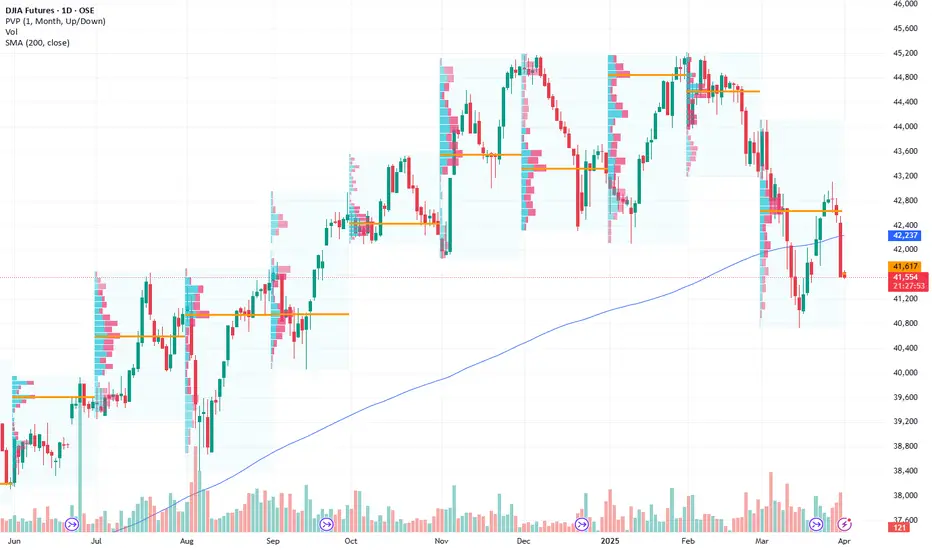
Dow has a support around 40,800 but overall bearish sentimentBased on the chart, there is support at 40,800 on weekly chart. I think this might push the market up a little bit for the next couple weeks but I predict it will go down to test the yellow line which has a support only both weekly and monthly charts.

Flow State StrategyPrice behaves like a single organism that moves in cyclical, parabolic patterns: from Higher Highs (HH) to Higher Lows (HL) to Higher Highs again, and from Lower Highs (LH) to Lower Lows (LL) to Lower Highs. Each Higher Low creates new buy orders that are fulfilled, leading to the formation of a new High. Likewise, each Lower High creates resting sell orders that are executed, resulting in a new Low. Once you understand, monitor, and act upon this principle, along with your chosen strategy, you can truly flow with the market's movements rather than against them.

Dow Jones Limit Buy Entry Trigger 42,027I am placing a limit order for a long position at 42,027 in the anticipation of a pullback to support. My stop is 150 ticks ( based on the 115 tick ATR ) and my target is 2.5 risk to reward or 375 ticks. Will I know if this support level will hold? No, and I don't need to. To me, this is a great location, and I am willing to put risk on to find out.
I am bullish the next three months and so, will mainly look for buy setups when they present. This trade, I am buying the level and not waiting for confirmation.
If you take the same trade, manage your risk as any trade can fail.

Bearish Outlook on Dow Jones Amid Corrective Phase- Key Insights: The Dow Jones is currently under bearish pressure with
institutional selling prevalent across major indices. The corrective phase
is expected to continue, potentially pushing the Dow towards support levels
between 39,800 and 39,700. Investors should prepare for market volatility
fueled by economic factors like upcoming tariffs, which may slow down
potential recovery actions.
- Price Targets: Short position advised next week.
- Targets: T1 = 39,700, T2 = 39,500
- Stops: S1 = 40,500, S2 = 41,000
- Recent Performance: The Dow Jones recently exhibited a downward trend, filling
a gap before moving further downwards similar to NASDAQ and S&P 500. This
decline suggests a consistent bearish sentiment is affecting the markets.
- Expert Analysis: Experts believe the Dow is in a corrective phase with an
eventual rally towards new highs expected post-correction. Current sentiment
remains bearish due to worries about tariffs and broader economic
challenges, but optimism exists for future recovery to levels above 47,000,
hitting as high as 51,000 in bull scenarios.
- News Impact: Market sentiments are marred by the anticipation of new tariffs
set to unveil on April 2nd. These tariffs could introduce significant
volatility impacting both equity and cryptocurrency markets, which will be
crucial for investors to closely monitor due to potential negative
influences on the Dow Jones trajectory in the near term.
MYM swing trade daily chartTrend lines are marked up on daily and the weekly trendline is the lowest trendline
the alerts are possible entries.
buy low, sell high unless it breaks support or breaks the trend wait for retest of that support
or trend line and buy or sell in that direction.

Dow Jones April Bullish Gameplan I am going into April Bullish. I believe this two-legged pullback is over on the Daily.
The ATR on the Daily has been a valuable tool to pick the lows. Every time ATR spikes and falls, that is the low.
I will be looking for price to slow down and layer into 41,580, form a higher low and start the bullish march back up.
The Monthly Chart
The Weekly Chart

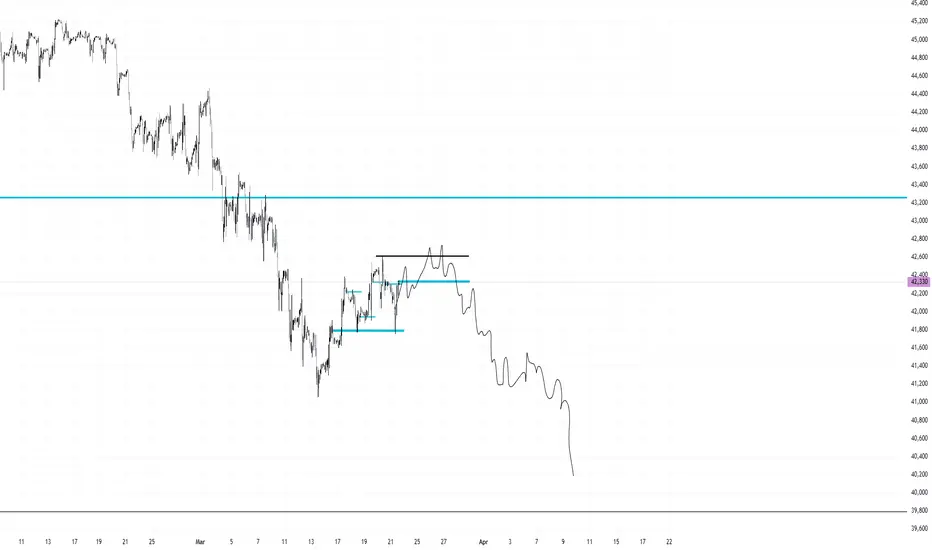
Dow Jones Futures Potential Short OpportunitiesDow futures reflect weak momentum, retreating after a 50% retracement of the prior 9% decline from 45075 to 40707, facing rejection at 43083.
Critical Supports: The immediate focus lies on 42416; failing this Support will accelerate losses to subsequent supports at 42214 and the critical 41882 level.
Resistance Levels: Strong overhead resistance at 42546, 42750, and notably at 42878.

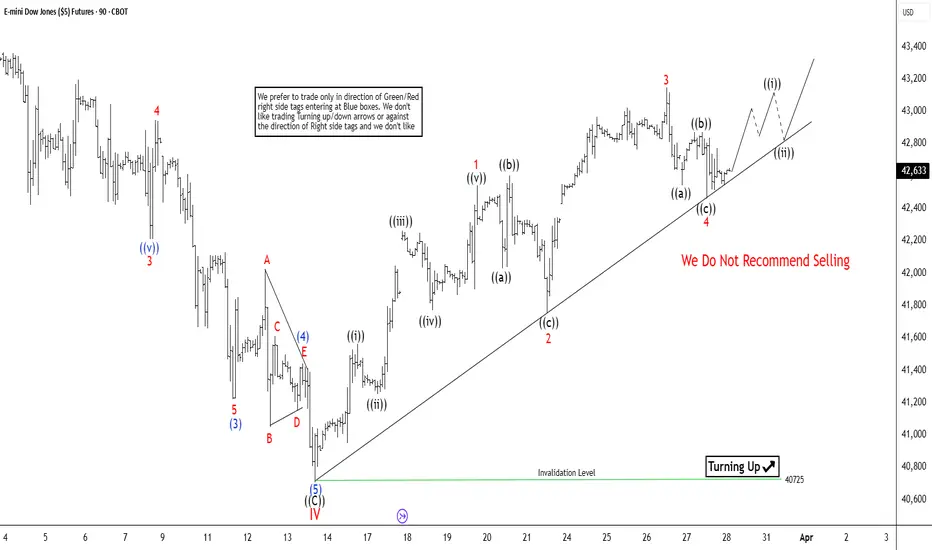
Elliott Wave: Dow Futures (YM) Poised to Continue Its RallyThe short-term Elliott Wave perspective for Dow Futures (YM) indicates that the wave IV pullback concluded at 40725, as illustrated in the 1-hour chart below. The Index has begun to climb in wave V. However, it must still surpass the prior peak of 45227, set on January 31, 2025, to eliminate the possibility of a double correction downward. The rally from the wave IV low has so far unfolded in three swings. For greater confidence in continued upward momentum, it’s advisable to wait until a five-swing pattern emerges.
The rally from wave IV is expected to develop as a five-swing diagonal Elliott Wave structure. From the wave IV low, wave ((i)) peaked at 41905, followed by a wave ((ii)) pullback that bottomed at 41587. Wave ((iii)) then advanced to 42388, with the subsequent wave ((iv)) pullback concluding at 41769. The final leg, wave ((v)), reached 42544, marking the completion of wave 1 on a larger degree. The ensuing wave 2 correction then found its low at 41751. From that point, the wave 3 rally reached its peak at 43148, followed by a wave 4 pullback that bottomed at 42459. In the near term, as long as the pivotal low at 40725 holds, anticipate that any pullback will attract buyers within a 3, 7, or 11-swing pattern, paving the way for further upside.
Dow Shorts - Cont'dI added another position on the retracement and took some off at the PDL now, the final target I am leaving for is the BISI and will close out the trade for today or if it hits my stop which is now halfway at the TP.
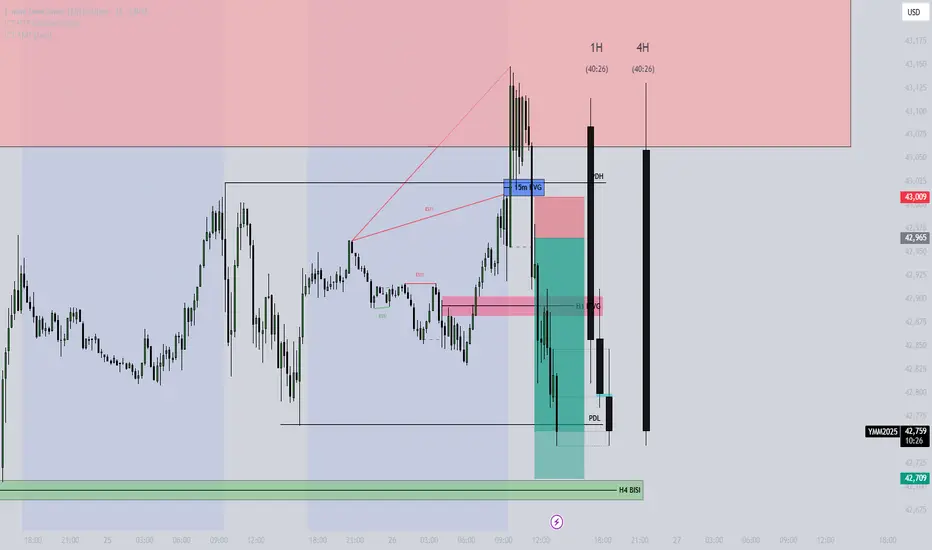
DOW Shorts: Better RRWhile NQ and ES was trending lower DOW was going higher. This was to take out stops, pair smart money orders and start the sell program. I waited for multiple confirmations before entering the trade. Buystops, rejection, CISD and IFVG. I could've entered earlier targeting even higher rr but the more confirmations there are showing bearishness, the higher the probability. This trade is risk free and partials have been taken. The stops will be adjusted accordingly and managed while letting the runner target the PDL. Let's see.

Dow Jones - Frontrunning Nasdaq & S&P 500When comparing Dow Jones to Nasdaq and S&P500, you will notice that this weeks price range is larger than the others, indicating that Dow Jones is the front running market.
Dow is the leading stock index pair to study. If I am expecting to see appreciation in NQ, ES, I want to see YM move first.

Last Week of March Possible Trending Cycle BearishThe last week of March is shaping up to be a bearish trending weekly cycle. I am looking for peak formation highs to be put in place and a bearish week to follow.
A sort of guide I am using is October 12th 2023
March 2025
The weekly chart shows a weak bullish resting bar that I believe will get erased.
My bias is still bearish for the remainder of the month
Promising Breakout Setup Ahead! Chart 1W CBOT_MINI:YM1! BLACKBULL:US30
Promising Breakout Setup Ahead!
The chart highlights RSI and Williams %R trendline breakout plays. My strategy? Identify trendlines on the chart, monitor RSI and Williams %R, and target breakouts on these momentum indicators.
Current Situation:
All key signals have already triggered.
Strong bullish seasonality
Favorable COT data (small specs bearish, commercials bullish)
Low open interest
This setup aligns with high-probability breakout criteria.
Chart Indicator
SMA 1W 52 (red)
SMA 1W 18 (green)
Bottom Indicators
WilVal
Williams R% 9 length
RSI 9 length
Not Financial Advice
for more questions ask in the comments or
check my X @valuebuffet

DOW JONES (FUTURES) SELL SET UPI have a 4hr down trend with a 1hr BOS and a 1hr RETEST for continuation down to previous low
HAPPY TRADING
