Full Breakdown of My Trading Strategy Dow Futures DaytradingI will be detailing my strategy to both help others and to help myself fine tune my strategy.
My strategy is one of market maker cycles. The end goal: to trade off of the Daily chart by drilling down to the 15 minutes for entries. Everything revolves around the Daily chart. The only indicator I us
Related futures

Range Bound July Fade The BreakoutNow that CPI has traded and closed below the monthly open, I am eager to see Wednesday's price action. I believe this is the Low of Month/Mid Month Reversal to trap shorts selling down low. Since the trend is bullish, I want to see buyers step in and pivot away from that low. Trap and shift.
I don
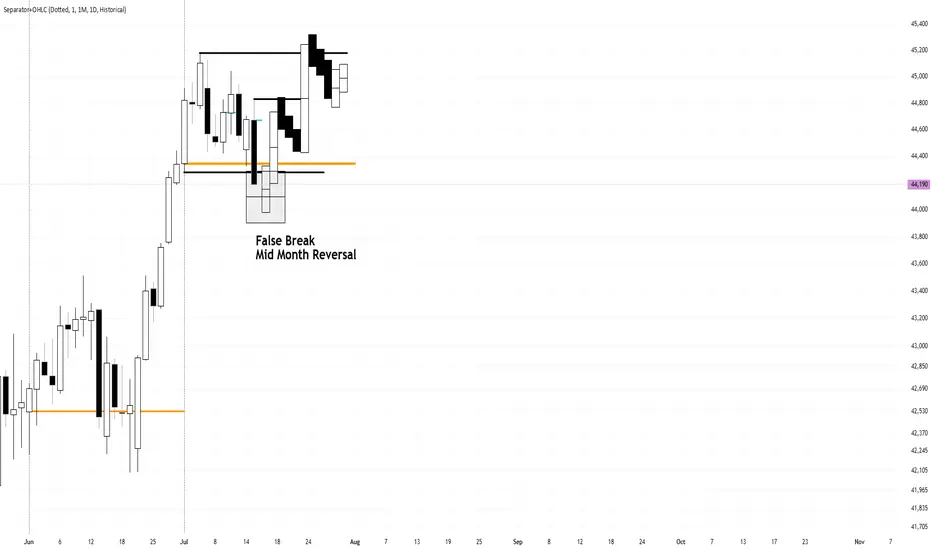
Monday Down Day (Want to Sell High on the Daily Wick)If Monday will be a down day, your best bet would be to finesse an entry ABOVE the open to form the Daily candle's upper wick. I would not sell anywhere else other than ABOVE. Look for a double top formation. It all depends on how the day sets up.
YM
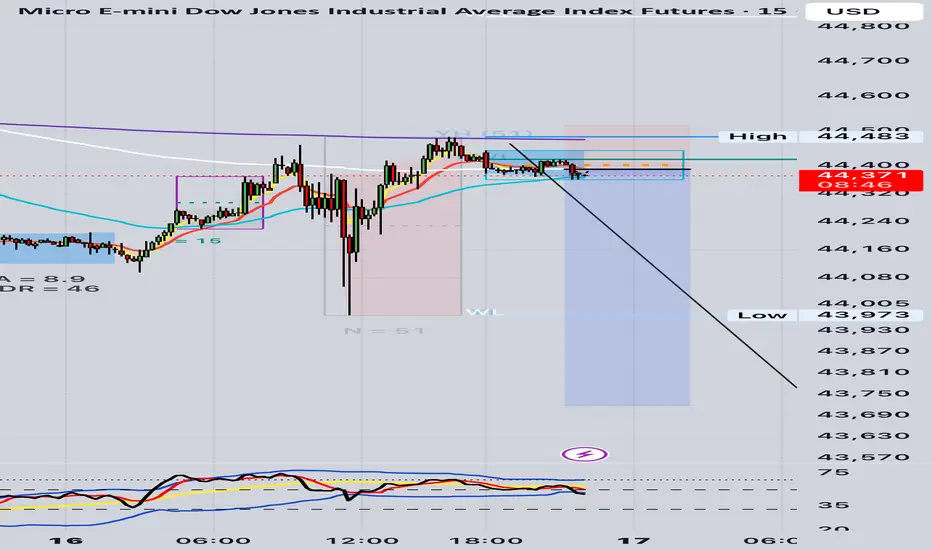
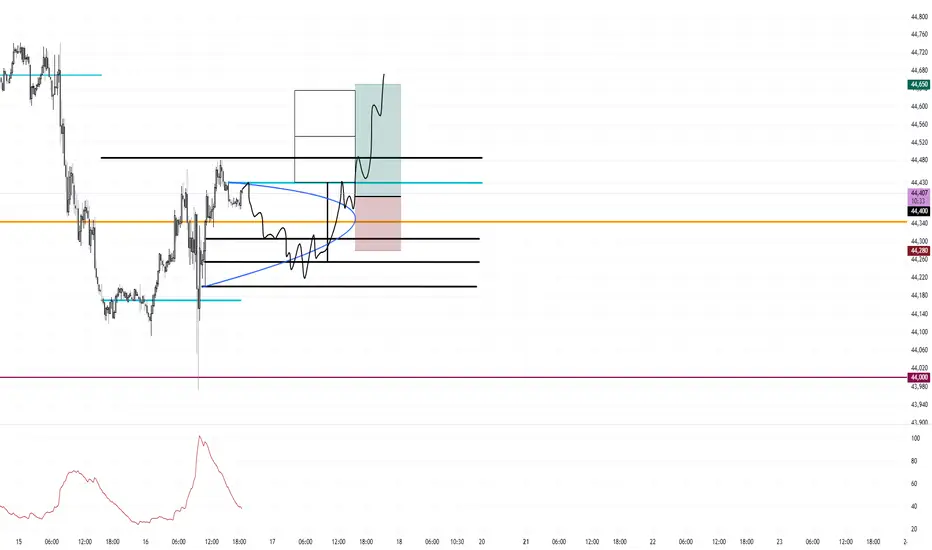
🧠 What Are Market Makers Doing Right Now?
Chart: YM1! (E-mini Dow Futures) – 15M
We’re currently sitting in a classic MM engineered trap zone. Here’s the full picture:
⸻
🔎 1. MM Trap Setup (M Formation High)
• Previous high at 44,481 = Potential PFH
• Strong vector push into that level → liqu
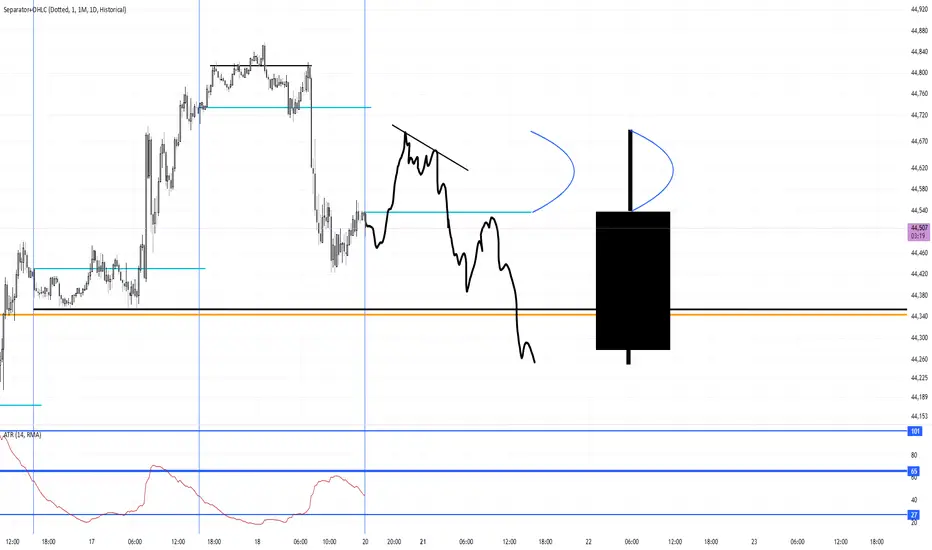
Monday and Tuesday Going To Be Down/Doji Resting Days Avoid!!Based on my intuition, Monday and Tuesday look to be avoided. Small, Doji days that will chop around on top of Monthly open and slightly under Thursday's Low. I will wait until Wednesday to look for the buy low day to take out Friday, Monday, Tuesday.
I bet price will open slightly down with a gap

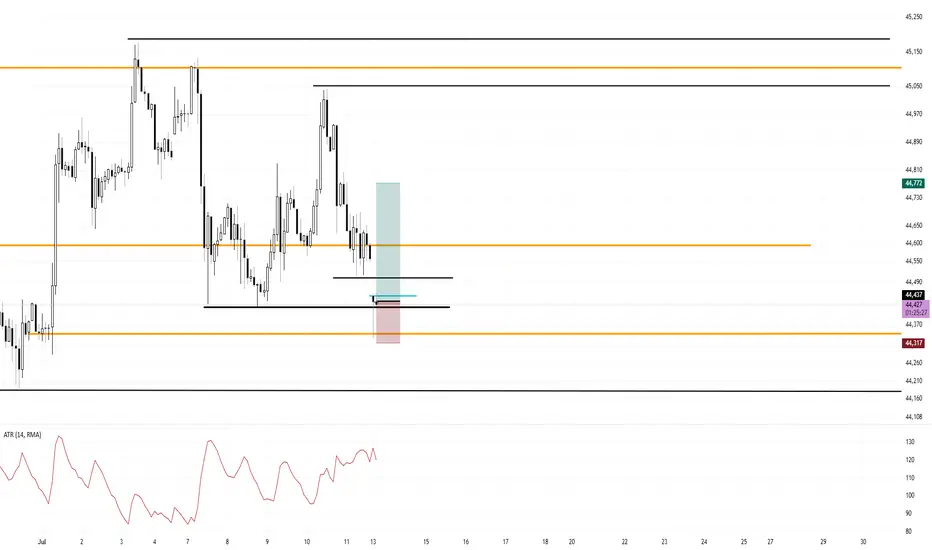
Range Bound Trade Trigger Long Dow FuturesI am Long now at 44,437
120 tick stop
335 tick target
Market gapped down, flushed the lows, tapped the monthly open by a hair and closed back inside. My stop is under the low and under the monthly open. My idea is that is will continue bullish back into the range.
Price is forming a range and mea
Buy Under Open Price Bullish Continuation Day RetraceI am looking for a bullish continuation day or First Green Day Buy Low Day. I want to buy low under the open to create the daily wick.
I marked the 3 lines where price has the potential to pullback to.
CPI Long Off of March's Monthly Open Possible NY SessionIf I can get a small doji formed after CPI at around the orange line (March's Monthly Open) I will enter Long.
Once entered, stop loss is 120 ticks and target the high 325 ticks.
I believe CPI will be whipsawed and range bound until NY opens up swinging
This is the 2 Hour chart for the pattern.

YM_US30-WEEKLY SELLYM traded down today (7/15/2025), as expected. Still expect more selling after a quick move to the upside (44,477) level. Sunday's open created a void, expecting it to be traded back into intraday.

YM_US30_DOW JONES_RECAP-WEEKLY-FVG_TAPPED-BUYWednesday has created the low of the week tapping into the weekly FVG, tomorrow i expect a continuation to the upside. Taking out previous weeks high.

See all ideas
Summarizing what the indicators are suggesting.
Neutral
SellBuy
Strong sellStrong buy
Strong sellSellNeutralBuyStrong buy
Neutral
SellBuy
Strong sellStrong buy
Strong sellSellNeutralBuyStrong buy
Neutral
SellBuy
Strong sellStrong buy
Strong sellSellNeutralBuyStrong buy
A representation of what an asset is worth today and what the market thinks it will be worth in the future.
Frequently Asked Questions
The current price of Micro E-mini Dow Jones Industrial Average Index Futures (Mar 2026) is 45,233 USD — it has fallen −0.41% in the past 24 hours. Watch Micro E-mini Dow Jones Industrial Average Index Futures (Mar 2026) price in more detail on the chart.
Track more important stats on the Micro E-mini Dow Jones Industrial Average Index Futures (Mar 2026) chart.
The nearest expiration date for Micro E-mini Dow Jones Industrial Average Index Futures (Mar 2026) is Mar 20, 2026.
Traders prefer to sell futures contracts when they've already made money on the investment, but still have plenty of time left before the expiration date. Thus, many consider it a good option to sell Micro E-mini Dow Jones Industrial Average Index Futures (Mar 2026) before Mar 20, 2026.
Open interest is the number of contracts held by traders in active positions — they're not closed or expired. For Micro E-mini Dow Jones Industrial Average Index Futures (Mar 2026) this number is 4.00. You can use it to track a prevailing market trend and adjust your own strategy: declining open interest for Micro E-mini Dow Jones Industrial Average Index Futures (Mar 2026) shows that traders are closing their positions, which means a weakening trend.
Buying or selling futures contracts depends on many factors: season, underlying commodity, your own trading strategy. So mostly it's up to you, but if you look for some certain calculations to take into account, you can study technical analysis for Micro E-mini Dow Jones Industrial Average Index Futures (Mar 2026). Today its technical rating is buy, but remember that market conditions change all the time, so it's always crucial to do your own research. See more of Micro E-mini Dow Jones Industrial Average Index Futures (Mar 2026) technicals for a more comprehensive analysis.