MZC1! trade ideas


corn maybe.Corn is potentially setting up for a good move higher, but the staggered double top might dictate price lower still.

🌽𝘾𝙤𝙧𝙣 𝙛𝙪𝙩𝙪𝙧𝙚 - we buy canned food for the New Year🚜ZC1! : 🕐 2W
Most likely, wave (V) of the "Supercycle" degree unfolding the ending diagonal I-II-III-IV-V , in which the growth is in wave III .
ZC1! : 🕐 1W
The growth marked with ((A)) is most likely over, although one more local maximum is not excluded. Further, a rollback is expected within the wave ((B)) of III , which has the right to take the form of any corrective pattern.
CORNUSD :🕐 1D
When the correction forms appear, at the completion of the corrective wave ((B)) of III , I plan to take a closer look at a long position on one of the available trading instruments, as well as at companies in the agricultural sector.
The wave marking in the double circle parenthesis corresponds to the green marking in the circle on the chart.

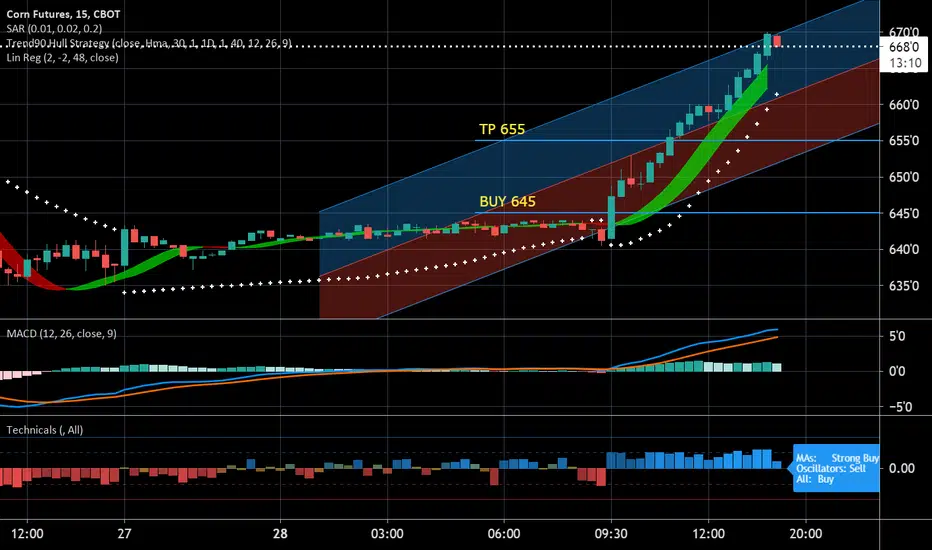
Corn Opening Bell Winner once againOnce again, I love volatility. The 9:30 opening bell is so many times an incredible thing. Look at the huge sideways action all night long and into this morning. I put a buy order in at 645 in case price action goes crazy at the opening bell and it did - straight up through my 30 HMA to my Take Profit of 40 points. Beautiful Monday!!
Corn Prices May be About to CrashCorn futures (ZC1!) just came off the highest monthly RSI print since 2008 around an 82 handle. We're likely going to see a vicious correction in the near term. Seems like everything is on the verge of a major correction at this point. I wish the Fed luck...

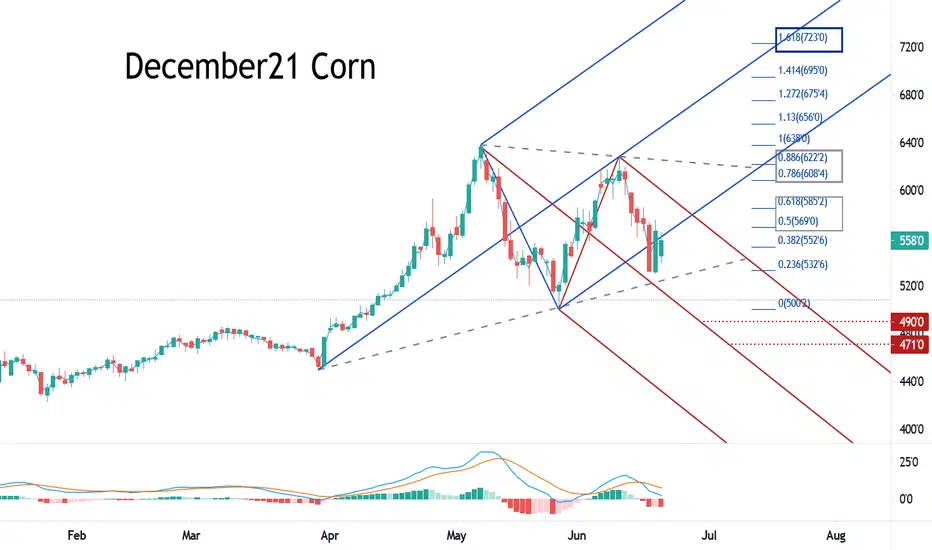
ZCZ2021 Dec21 CornDecember 21 Corn - Daily: (red) Downtrend pitchfork’s median line is working with the (grey dashed) uptrend line to attract prices lower toward support identified at 5.15 to 5.25. Further risk 4.90 to 4.71
Key resistance targets above at 6.08 and 6.22. A breakout above could target any of the upper retracements in search of the primary target at 7.23
ZCN2021 July21 CornJuly Corn – Daily: The (red) Downtrending pitchfork is in a battle with the (grey dashed) uptrend line. Price action may still target a move lower following the median line if the uptrend is broken. Support is 6.02, pattern targets have risk at 5.64 to 5.43.
Resistance at 6.69, 6.85 and 7.07. If met, 7.07 should act as strong resistance and a breakout above could lift strong and fast to the Primary target at 8.17. **For trades, not much time left for the July contract before first notice day**

ZC1! Continuous Corn ChartCorn – Weekly Cont: July Contract leading the Cont. chart back towards testing the blue Tenkan line at 6.60. A close below the blue Tenkan line is the first since August of 2020…Important for corn bulls to see this week close above the Tenkan. Support below is the May low at 6.02 and then the red Kijun line (trending higher) at 5.85
Resistance above at the recent swing high of 7.17 and then the 7.35 high. Targets above at 7.92, 8.36, 8.60 and 8.93.

do you smell the bullshit? fed keeps trying to feed us this narrative that inflation is going to be transitory....
that is not the way i have seen the world to work. once prices rise they never go down. think about your local retail store. once those 10 cent bags of chips went to 25 cents..... they never went back to 10 cents. actually now they are 50 cents.
i drew a chart on how i see the movement of corn. down until end of august.....reach a peak sometime mid 2023. by that time i expect corn prices to be over 300% - 400% of what they were last year.
my suggestion? get ahead of the curve. ask your manager for that raise. do not accept having your standard of living diminished because of some socialists in administration. stand strong and fight for your right to life liberty and pursuit of happiness.
you can also expect some radical individual like trump to come back in 2024 as people will be begging for change.

Short /ZC, revised with lower risk- Key reversal with inside day bar.
- Unfortunately, this bar is a big inside bar; recommendation is to go short at open and cap it with the SL above the previous day's red bar.

Short /ZC- Double top with key reversal on weekly.
- Recent key reversal indicates end of uptrend and confirms lack of potential for any further upside.

Jun 16, 2021 Corn WinnerGrabbed a quick 16 points this morning. I missed early morning as I was still sleeping but if I was awake at 6am I could have been in the trade at 665 instead of 670. As usual, I took my quick 16 points for a great morning win before the Fed 2pm Gong Show.

Jun 13, 2021 Corn Selling FastAgain, at the opening bell at 8pm, price action was undecided for the first 5 minutes - then BAM - straight down, hit my sell order at 670 and a quick TP at 664, all in less than 15 minutes - Brilliant! Have a great night :-)

the corn maze whistles please note that 6/10 into july are bearish periods for corn.
many people think with inflation and the heat wave on the west coast that the corn prices will go up.... i am taking the opposite side and will ride short position until july

Quick 24 points on CornOnce again at the opening bell, price action plummeted and my sell order at 688 was executed. Within 20 minutes my Take Profit of 24 points was hit and I made off with some quick morning profit - great start to a Friday. Happy Friday to all and have a safe weekend.

Jun 10, 2021 Quick 5 point profitGreat start to the day as the opening bell price action worked again in my favor to snag me a quick 5 points in less than 30 minutes. Put my Buy order in at 702 and waited for 9:30 - Price action went straight up and took my profit at 5 points.

Jun 9, 2021 Corn quick 5 pointsSnagged a quick 5 points at the opening of the DJIA. Corn passed up through the 30 HMA quite aggressively so it didn't take long at all to grab the 5 points and run. Nice start for the day.


Quick 28 points on CornTook advantage of the opening bell at 9:30am and profited me a quick 28 point gain on Corn this morning. Price action quickly moved down past my 30HMA and followed it down on the 5 minute chart and TP after 28 points. Great day making some daily cash.

Short CornMonthly reversal
HS (albeit crooked) on the daily with a retracement above the neckline and subsequent turn towards the downside.
Potential eager entry below the 5/28 bar or a sell-stop below the neckline.

BEARISH ON US CORN (HEAD & SHOULDERS)Bearish clues:
- Head and Shoulders
- General downtrend since begining of May 2021
- Lagging Span of Ichimoku indicator broke down the lower band of Bollinger Bands
- Price broke down the 200 exponential moving average
The price of US Corn broke down the neckline of the Head & Shoulder. It could now reach the 23.6% retracement Fibonacci level at $5.80/bushel and next the daily support at $5.30/bushel.
Feel free to share, comment and give your opinion if it is constructive ;)
DISCLAIMER: This is not investment advice

SHORT-TERM BULLISH ON US CORNBullish clues:
- General uptrend since August 2020
- Price rebound on the lower band of the Bollinger Bands
- Price rebound on the 50 exponential moving average (support)
- Price rebound on the Kijun of the Ichimoku Cloud
- Hidden bullish divergence on the Relative Strength Index ( RSI ) since October 2020 + RSI could rebound on the 50 level
- Squeeze pattern of the Bollinger Bands in hourly time unit => price explosion to come + ascending triangle
Target:
The objective is the psychological level of 700'0 (resistance). This could possibly lead to a double top , as the bullish movement is losing its power.
Feel free to share, comment and give your opinion if it is constructive ;)
DISCLAIMER: This is not an investment advice
