MZC1! trade ideas


CORN FUTURES, 1D, CBOTTrading Signal
Short Position (EP) : 374.5
Stop Loss (SL) : 380
Take Profit (TP) : 362.25, 346
Description
ZC formed Double Repo Sell at 1d time frame. Trade setup with Sell Limit at 0.382 Level (374.5) and place stop after 0.618 level (380). Once the position was hit, place take profit before an agreement (362.25) and 346
Money Management
Money in portfolio : $150000
Risk Management (1%) : $1500
Position Sizing
$0.25 = +-$12.5 (Standard)
Commission fee = -$2.82/contract (Standard)
EP to SL = $5.5 = -$275/contract (STD)
Contract size to open = 5 standard contracts
EP to TP#1 = $12.25 = +$612.5 (STD)
EP to TP#2 = $28.5 = +$1425 (STD)
Expected Result
Commission Fee = -$9.02
Loss = -$440
Gain#1 = +$588
Gain#2 = +$912
Total Gain = +$1500
Risk/Reward Ratio = 3.34

ZC1 uptrend resisting Fib levelCorn futures ZC1 have touched the 50% Fibonacci level on three occasions and failed each time. Looking for a reversal to the uptrend

Corn Future DEC18 (1d)Trading Signal
Long Position (EP) : 358.25
Stop Loss (SL) : 355.25
Take Profit (TP) : 367.25, 371.25
Description
ZC formed Double Repo Buy at 1d time frame. Trade setup with Buy Limit at 0.382 Level (358.25) and place stop after 0.618 level (355.25). Once the position was hit, place take profit before an agreement (367.25) and 371.25
Money Management
Money in portfolio : $133,000
Risk Management (1%) : $1,330
Position Sizing
$0.25 = +-$12.50 (Standard)
Commission fee = -$1.67/contract (Standard)
EP to SL = $3 = -$150/contract (STD)
Contract size to open = 9 standard contracts
EP to TP#1 = $9 = +$450 (STD)
EP to TP#2 = $13 = +$650 (STD)
Expected Result
Commission Fee = -$30.06
Loss = -$1,350
Gain#1 = +$2,250
Gain#2 = +$2,600
Total Gain = +$4,850
Risk/Reward Ratio = 3.51

Corn Future DEC 2018 (1d)Trading Signal
Long Position (EP) : 368
Stop Loss (SL) : 364.5
Take Profit (TP) : 384.5
Description
ES formed Double Repo Buy at 1d time frame. Trade setup with Buy Limit at 0.382 Level (368) and place stop after 0.618 level (364.5). Once the position was hit, place take profit before an agreement (384.5)
Money Management
Money in portfolio : $133,000
Risk Management (1%) : $1,330
Position Sizing
$1 = +-$50 (Standard)
Commission fee = -$2.82/contract (Standard)
EP to SL = $3.5 = -$175/contract (STD)
Contract size to open = 7 standard contracts
EP to TP = $16.5 = +$825 (STD)
Expected Result
Commission Fee = -$39.48
Loss = -$1,225
Gain#1 = +$5,775
Risk/Reward Ratio = 4.57

Previous Target hit. 1D Channel Down continuation. Short.The TP = 372.20 has been hit and the 1D Channel Down (RSI = 37.956, Highs/Lows = -0.2679, B/BP = -1.4820) continues to deploy on a standard manner. Next TP = 337.20 which is the November 13, 2017 bottom and a very likely candidate for a rebound. If it breaks then 320.40 is next.

CORN 2 day swingsOn Monday 366 would turn up your 2 day swing chart and will also break the daily swing highs

Bullish SharkBullish shark with bullish divergence. Waiting to see how price reacts to the reversal zone (purple box).

Larry Williams "Smash" TradeThis pattern is described on page 101 of Larry Williams book, "Long-Term Secrets to Short-Term Trading."

#ZC_F $ZC_F #corn - Bear spreadCorn has done what I expected and my bear spread ZCN19-ZCZ18 reached my PT. $190/contract profit.

Break out point on 1DAfter breaking the 1D Channel Up (Highs/Lows = -12.9821, MACD = -1.170), Corn just bounced off the first important support at 380. We will either see a strong rebound here (long with tight SL, TP = 392.40) or if 379 breaks, it will look for the 372.20 support (TP = 374).


#ZC_F $ZC_F #Corn bear spreadBear spread ZCN19-ZCZ19. I have opened a position at 16. SL is set at 14, PT 20.

Short Corn versus Soybeans/WheatTesting trading method to sell weakening Ags and buy strengthening Ags

Corn, beautifulSelf explanatory. Bullish patterns all over, also check out weekly and monthly TTM squeezes.


#ZC_F #Corn - SHORTCorn is in a significant S/R zone. Morover, COT report confirms overbought market.

Possible Wave StructureCould be a big 3-3-5 Flat where wave (C) can be either impulse or diagonal
also note previous wave (4) ended near 38.2% retracement level


CORN Calendar SpreadZCU18-ZCZ18 has started its seasonality in March (precisely March, 14) and will end on August, 4. Spread that now is back interesting for open a short position for several reasons. Not only the seasonality (20 winning years in last 20), the Relative Strenght Index is in strong overbought and there is a "fundamental" consideration.
The September delivery future will increase its value more when corn is harvested compared to the December contract. In practice, there will be an expansion of the contango. The price of the corn (but not only) is always higher before the harvest. Then it arrives on the market and increases the offer, and if there is not also an increase in demand, the price will start to fall (as the seasonal patterns suggest) and it is for this reason that I sell the corn in hedging between May and June.

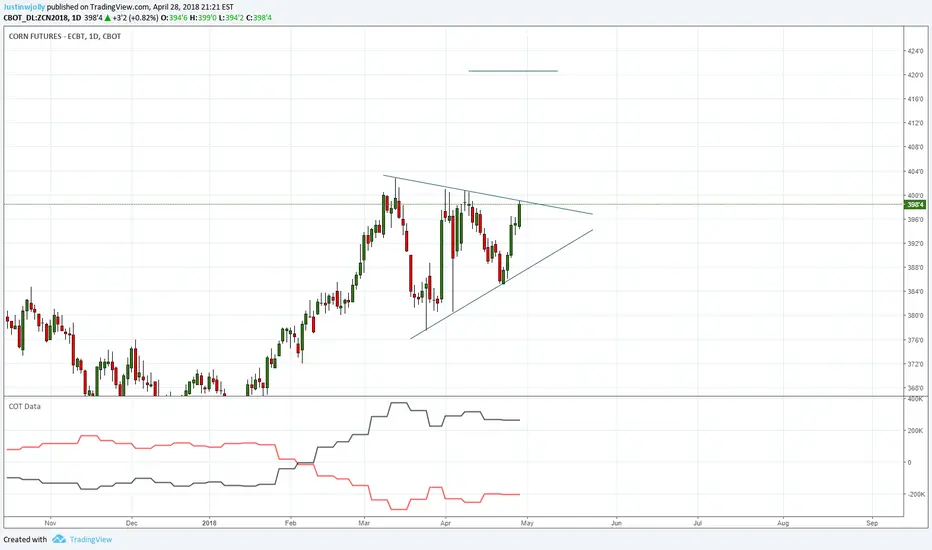
July Corn long-6 Week symmetrical triangle
-Constructive Commercials/Large specs positioning
Am a buyer above 400'6, my err is towards caution and thus will allow 30 basis points of risk. Expression of this trade idea will be though CFD's commodities contracts
Not original idea