March 22 SoybeansMarch Soybeans - Daily: March beans showing a strong move from 11.93 to 13.84. The daily chart shows support at the blue Tenkan line and near last week’s low of 13.34. Further support is the red Kijun line at 13.04 and then the uptrend line. Risk at 11.91 and lower.
Targets above at 13.84-13.91, 14.16, and 14.45. Any New bullish sentiment could find targets up to 16.01….
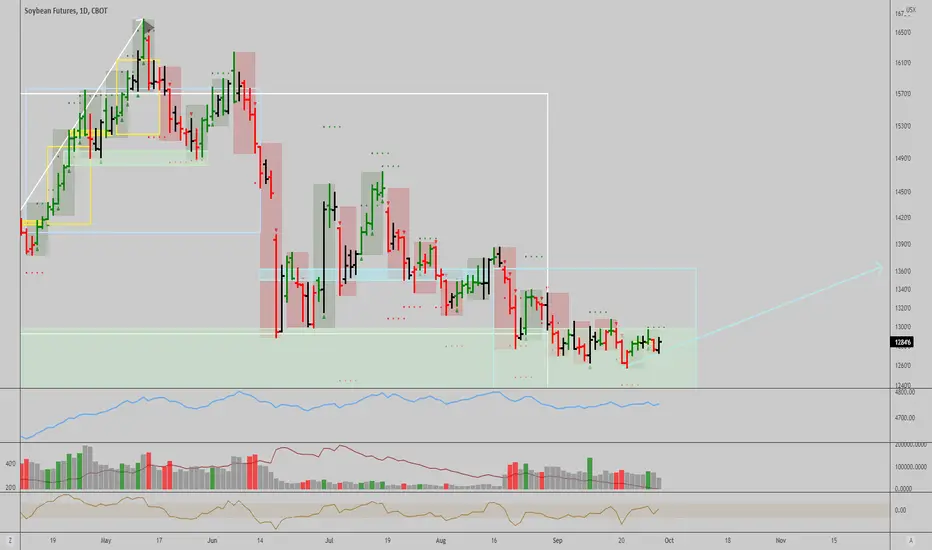
MZS1! trade ideas

Continuous SoybeansSoybean – Weekly Cont: The High to Low Cycle appears complete (for now) with the break above the downtrend and 24% retracement. Beans filled the 38% target with a 13.84 high. The close last week is concerning as it left a doji like formation that could be cause for a change in trend??? Beans need to get above 13.84 (preferably a weekly close) to negate this potentially bearish candlestick. Risk for the next week or so is a move down to re test the down trending line it just broke above. Risk is 12.82 next week
A move above 13.84 will target 14.24 and then 14.81.

Big Picture Market structure for SoybeansCurrent Market Structure: **(Like Corn) Sensitive, with extreme bandwidth** The current Domestic and World Supply & Demand numbers paired with recent inflationary threats support a price base range (IMO) from 10.00 to 12.00. Currently risk has been to the upside and inflationary threats elevated, keeping beans elevated as well. There are to many variables that affect the fundamental picture, expect volatile markets untill the Market structure becomes more defineable.
Resistance area from 12.75 to 14.00 and then 16.00 area. **12.75 to 14.00 is an area that some pricing and protection should be encouraged
Support area is 11.80 to 11.40. Further Risk is 10.00 – 9.00.

BULLISH ON SOYBEANSSymmetrical triangle => BULLISH
Break up of the 200-period moving average => BULLISH
Fundemantals: dry climate conditions in South America (Argentina and Brazil) = less production => BULLISH
Well supported by the RSI , which could enter the acceleration movement => BULLISH

Like last december long SoybeansLong above 18 moving average with the trailing stop below lowest low of prior two days

Breakout ofnSoybean FuturesSoybean futures has corrected 50% of the previous impulse move that stretched from middle 2020 to May 2021. The latest breakout therefore implies the possibility of a new bullish wave back to at least the previous swing highs @ 1650 with an initial target of 1490. Stops can be considered @ 1198

food for thought soybeans look good.
seems like people are waking up to inflation.
i talked about inflation a year ago, before anyone even knew it was coming. time cycles predicted it correctly. historically wars have been started during these kind of times. watch uranus in gemini as that is historically when america had some of the biggest wars (2025-2032)
1760 = war with britian ( gained independence)
1850s = indian war (gained west coast)
1940s = ww2 (gained world currency domination)
as you can see from above, each passage of uranus through gemini has created earth shattering changes for america.
fun fact. july 4 1776 would mean america is a gemini. also it means uranus was in gemini at the time of conception. a return of uranus to the position of birth always has an effect.
another fun fact. there has never been one instance where a planet passed the midheaven of america without causing a change in trend in the equities and bond market.
merry christmas and happy new year.
next year will be epic and i will be right here to navigate it with you.

The bulls May come back If we break the triangle we can see a up Trend. We stopped at the support line that I mentiond and it looks like we can continue the rally, I mentioned the resistance Levels as first exit points.

November 2022 SoybeansInitial thoughts on hedge/pricing targets with the current Market Structure for 2022 Soybeans

November 2022 SoybeansNovember22 Soybeans – Weekly: Consolidation above 12.00 and looking for direction. The blue Tenkan is about to cross under the red kijun. Support is 12.02 and 11.84 with risk down at 11.50. A break below would target the 10.97-10.75 area.
Resistance against the red Kijun line at 12.32 and then the down trending line. Initial targets at 12.95-13.13. Upside potential on a breakout will look for 14.14.

January Soybeans - DailyJanuary Soybeans - Daily: The January contract shows a different picture than the continuous. Jan beans did break above the trend line and 24% retracement, but fell short of the 38% target. The cloud resistance stopped beans at 12.89. The move below the trend line is concerning. There is a Harmonic Pattern potential for a reversal at 11.93-11.81. We need a couple of daily closes above the trend line and the red kijun line currently at 12.30 to keep this from continuing bearish. A break out above the trend line, the cloud, and 24% retracement could excite the bulls for strong gains. **Again this is volatile, Use options to help make decisions if needed…

Soybeans Weekly continuous chartSoybean – Weekly Cont: Soybeans struggled to get weekly closes inside the cloud and now working to break below the blue Tenkan line. A High to Low cycle needs to see a break above the trend line and above the 24% retracement to move out of bearish territory. The failure below 12.96 suggests we are not bullish. A weekly close below 12.30 targets the 11.81 lo. **Caution, many times a failure to move above the 24% target suggests a new low. 11.67, 11.52 and 11.37 would be targets below with 11.14 the primary target.
We need a weekly close above 12.30 and a recovery soon back into the cloud with price action above 12.96 to negate the bear.

Longterm Soybean Market structureCurrent Market Structure: **(Like Corn) Sensitive, with extreme bandwidth** The current Domestic and World Supply & Demand numbers paired with recent inflationary threats support a price base range (IMO) from 10.00 to 12.00. Currently risk has been to the upside and inflationary threats elevated, keeping beans elevated as well. There are to many variables that affect the fundamental picture, expect volatile markets untill the Market structure becomes more defineable.
Resistance area from 12.75 to 14.00 and then 16.00 area. **12.75 to 14.00 is an area that some pricing and protection should be encouraged
Support area is 11.80 to 11.40. Further Risk is 10.00 – 9.00.

continuation pattern. this is an update on my previous post. a higher low on the shorter term time frame was my cue to prep myself for another move to the upside. atm, we have an inverted head and shoulders formation within a bull flag pattern on the 30-min.

Soybeans: Close to a buy signal once again...The last time we had a perfect storm situation to buy grains, we had a monster rally in both corn and beans. We are now in a similar situation, with the recent surge in Nat Gas affecting fertilizer prices. Weather in Brazil is problematic and China is struggling to produce grains locally...We are once again nearing a situation where reward to risk for buying into grains is tremendous. I'm long Corn futures already for a couple days and waiting for the daily chart to trigger a technical buy signal in Nov Beans to go long as well.
The last weekly signal expires by next week, as a failure, price hit really oversold levels and reached monthly support (see green shaded area). Implications are a retest of the weekly down trend mode (as shown by the arrow on chart), at least, which can then evolve into a new weekly uptrend, once the daily trend turns up. And potentially trigger a new monthly signal similar to the one we had before...This is an interesting juncture to enter long term positions in grain futures.
Cheers,
Ivan Labrie.
trend continuationprice has settled on support as seen on the 4-hr timeframe. expecting a lower low setup on the shorter timeframes for price to resume its ascent.

opportunity for re-entrysoy went from being one of the hottest commodities to losing all its steam. a double bottom, a classic reversal pattern, was formed last week. after descending for months, a retracement to the 50/61 fib level could mark the beginning of an uptrend.
some confluence: the DBA broke out of its ascending triangle chart pattern.

Soybean Bollinger Band SqueezeThree squeezes are noted on the chart with the current one having a yet-to-be-determined resolution. If it plays out according to theory (source: John Bollinger book "Bollinger on Bollinger Bands"), the price action will begin a strong move either up or down. Based on the descending triangle-like nature of the current formation, and the bearish readings on the MACD, I'm watching for a price break to the downside. If it breaks to the upside, I'll be bewildered.
The price bar coloration is based on the MACD Hybrid BSH which is a script I made and is available for anyone to use. The colorization logic is explained in the script. Basically it interprets whether the standard MACD is bullish, bearish, or neutral. I'm watching for a red signal which would be triggered by the MACD crossing to the underside of the signal line again. I'm setting an alert to 1240'0.

Soybeans minor support tradeQuick and dirty trade idea on soybeans. Nothing fancy by any stretch of the imagination.
Previous 11.85 support is being tested, maybe we can make a dollar or two based on a quick pivot to the upside. As a result, a very tight stop loss is in order, this trade has a very high reward / risk ratio. No time will be wasted, the market shall crash though support and we move on to other trades, or perhaps we can make a small profit.

Continuous SoybeansWithout a S. American weather problem soybeans could struggle. Corn and wheat are doing the heavy lifting. I am neutral this market for now.


Soybeans US Dollar: Usually trends lower into major China export programs. Trends higher after export program concludes.
Some resistance ahead. A move lower would help grain exports….
COT:
Commercial Net (green) is tipping lower, about neutral. Selling by farmer to commercial met by equal buying of end users.
Commercial Shorts (yellow) recently adding to shorts, but pace is far behind last year. Last year the farmer sold out at harvest, leaving the Cooperatives heavily short and the funds long. Leaving the end users open to upside risk….
Commercial Longs have been adding, locking in the high crush margins.
Funds are exiting their longs
**These indicators lag behind change in trends. Currently using this data as an observation as it is too early to give a signal if low is in. A lower move nearby doesn’t appear to have staying power for a complete season….

sourbeansinverse headnshoulders out of descending triangle, good pattern combination.
looking for 100 MA
