Soybean bottomFUD and counter FUD cancel each other.
Food is important, it should be expensive.
Think of the farmers!
Let's fill our bags and run away with sellers money muahahaha.
MZS1! trade ideas

ZSK2019: Soybean futures have been on the slideI mentioned this in my earlier read (few months ago) and this is certainly leading us to believe that trade deal is not even close.
Soybeans failed to bounce at medianInstead gapped down and have been working on gap fill. I would look for a short position with a stop on the “bull side” of the median.

Soybeans failed to bounce at the pitchfork medianAs the saying goes, a failed bullish move is all the more bearish. Price gapped down at the median. I would try building a short position, with a stop on the other side of the median.

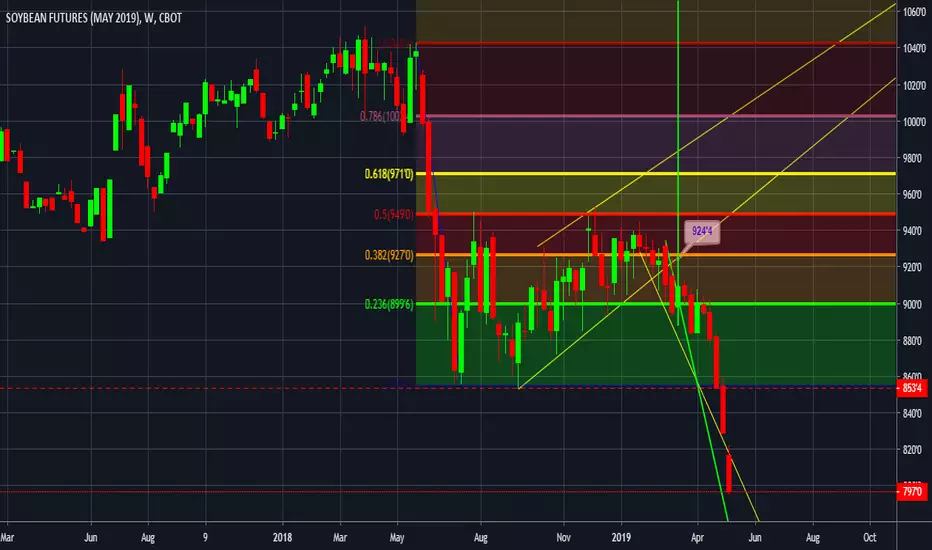
Soy at the crossroadsThe soybeans are suffering, but why? To give an answer you must look for the fundamentals, and the main one, are due to the duties between CHINA and USA. Since the USA is the largest exporter in China and, as African swine fever is literally undermining the global stability of pork, the barns are destined to remain full. Even the report of the WASDE gave an optimistic estimate that was exceeded in the negative that, if it does not resolve the issue of duties, will remain long in the barns. Returning to the chart according to Elliott we are in the final zone for a correction, in fact the area of the 61.8 has many factors that intersect with one another and are: the maximum level of Z wave, max level for Wave Z, that of Wave B and a support which is perfect online with Wave 2, then there are the factors of A.T. and are: volumes with SMA facing upwards and volumes of buyers Rising and RSI in oversold. These are some of the factors that I consider. So, I'm expecting two medium scenarios, and the first one is: The price goes up in the next few days, or it goes down to 857'6/lb. and then back up. As from graph.
This analysis is purely for educational purposes both as a written analysis and as a graphical analysis and is not intended to propose investments of any kind, those who work according to this analysis will have to assume the blame for any losses exclaiming those who wrote this Analysis.


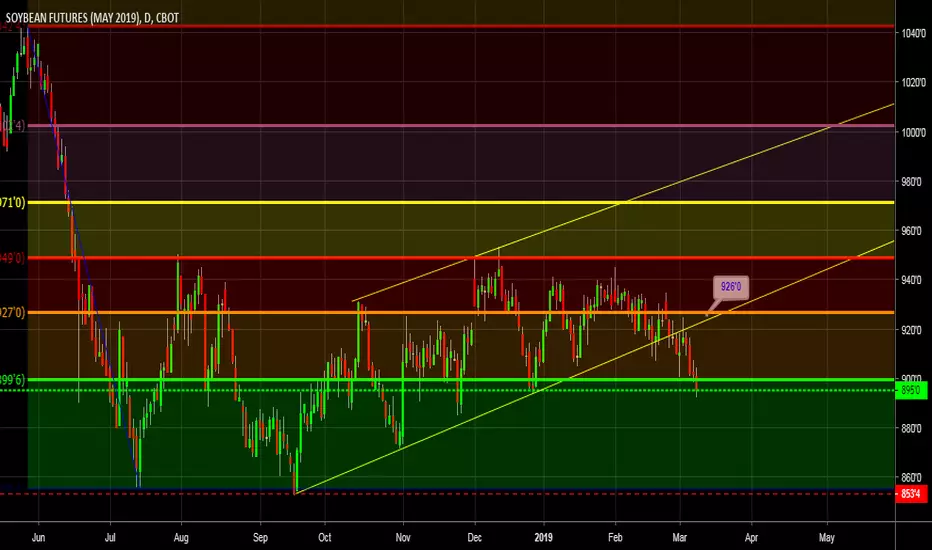
Soybeans ahead of a big move. Key levels and volatility to watchWeekly:
- Ichimoku is neutral with price located in cloud
- Kijun Sen acts as major key support at 890
- Upper key level is 938 (forward Senkou B line)
- Heikin-Ashi shows indecision with slight positive bias by haDelta+ and haOscillator
- EWO is positive
Daily:
- Ichimoku is neutral, but as Kumo cloud is very thin and the horizontal key levels are close to each other, we can easily see a breakout in any direction
- Heikin-Ashi shows indecision. Note: quantitative indicators are still holding above thei mid lines (minor positive)
- EWO is minimal bearish
- Support is 890-895. If it breaks and closes below 890, then Ichimoku setup turns bearish. On the top side we have 912-915 to fight with, but a textbook confirmed bullish breakout would need a higher high on close above 930.
Important note:
Both 14 days and 14 weeks (!) ATR is extremely low, which means we have a very supressed volatility. It won't last for very long. Maybe it is time to examine 880 / 930 straddle too.


Soybean futures suck...No trade deal may be???It has broken the long support and headed below. Look it up. Started following this to see how things are w.r.t China trade deal. This gives me bleak picture.
Hope I am wrong.
ZSK2019: Soy futures tell a different story.Soy has been the hardest hit and been victim of trade war. This should be perking if the trade deal is likely in anticipation. Instead this chart looks weak and almost a head scratcher. I have been following this for some time and this does not look good.

Soybean Selling opportunityKey level: 1082’4
Soybean market has been in sleeping mode since JULY 2018.
Uptrend sideways movement that clearly develop into triangle pattern add support to our wave count that soybean are currently in wave (4) phase.
By using Elliott rule of “WAVE 4 never enters the price territory of wave 1 and 2”, we can establish a strong invalidation level of 1082’4 served as our key level for this wave analysis
Trading strategy:
Wait for a clear impulsive 5 wave structure down to support the idea of wave (4) is already in place
Happy trading

Something brewing with agricultureI have noticed agriculture volumes were soaring recently, maybe I am out of touch but those are the numbers I had in mind before:
Soybeans (5B), Corn (2B), Wheat (1B), Cotton (900M), Coffee (600M), Sugar (500M), Cocoa (300M)
And now they are 2 to 5 times higher, what's up? ==> Soybean Futures 10-15 Billion, Corn futures 10-15 Billion, Wheat 4-5 Billion. Those are the CME ones, the ICE sucks hard but I noticed Sugar volume at over 1.25 Bil yesterday for March contract alone. So in total basically 30 to 50 billion usd a day for the 7 big ones.
Then you got all the other ones, I saw live cattle was at like 1.5 billion yesterday (wat?), lean hogs at 500+ million...
Buahahaha even orange juice futures are over 300 million. Orange juice futures, what a meme. Who even trades that?
* Do not look at tradingview volumes they are all wrong.
How it looks on higher TF:
Corn:
Wheat:
Sugar:
Here is what I am looking at immediately:
Trump is trying to shill, buuut doesn't seem to be working.
Wheat is on a massive selloff US business has been lost to France (get rekt).
Investors are counting on a positive trade deal and I think this is why prices have been going up for the past months (same concept as stock market).
I heard artificially inflating prices with hope and presidential tweets worked just great.
I bet Trump has been postponing everything just because dumb investors kept buying in anticipation of that trade deal. No matter how much it gets postponed they just keep buying like little lemmings, and Trump keeps posting the Dow Jones gains since he started his term & what a great president he has been so he clearly has a motive.
Can't blame him, most people are too stupid to figure out any of this, he is just doing what a politician does. Maybe he's one of these "with an IQ of 130 that thinks he is at 170" guys I have been hearing about (Elon Musk too according to Charlie Munger).
What I think is either on positive news investors will take profit (buy the rumor sell the news),
and on bad news. Oh my. All this volume, they're all going to want to sell, right? I do not think we will see a short squeeze, who is shorting this? Nah. Could be wrong but from experience people are not that smart.
I really want to trade this, but this is my advice: just do not touch it. Let's wait for the big burn to pass, and then after we shall trade those.
And remember,
* When prices go up, greedy agri giants (that have traders and actively invest in this) rub their hands and make profits on the back of poor people that can barely afford food (Remember Glencore backlash after stating prices explosion 10 years ago was very profitable)
* When prices go down, the poor little farmer is suffering while governments and big players step on them and make profits (they're protesting and telling every one how angry they are right now because they feel people in power do not have a high opinion of them and that hurts their feelings - really not even kidding - as well as taxes and high gaz prices)
* When prices do not move "nothing ever improves". How do you make price never move anyway?
Prices going down should mean people in civil war countries could get to eat, sit and watch farmers go on a rampage, block roads, burn hundreds of thousands of tons of crops to reduce supply.

SOYBEANS LONG TERM BY DANIEL BRUNO, CMTDANIEL BRUNO, CMT
I HAVE NOT EVEN LOOKED AT A SOYBEAN CHART IN 13 YEARS
PRICES HAVE RETRACED CONSIDERABLE SINCE THE HUGE RUN UP C. 2007
MONTHLY AND WEEKLY TIME FRAMES ARE BEARISH, HUGE RED ENGULFING IS LAST CANDLE

Rising Wedge Continuation for Soybeans?Today I am looking at SX2019. This chart looks awful similar to a rising wedge continuation pattern. With the export problem, and the amount of beans we have in the U.S., I wouldn't doubt this is possible. This idea is for chart pattern purposes only. Lets see where it goes.
Everything here is purely my opinion, and in no way advice or recommendations on making trades. I may or may not hold positions in the instruments I analyze.
L.R.

#ZS_F $ZS_F #Soybeans – BULL SPREADI built a calendar bull spread ZSQ19-ZSU2019. It has nice potential. RRR 2,5.
Entry about 3,0
PT 8,0 ($550)
SL -6,0 ($150)

#ZS_F $ZS_F #Soybeans – LONGThe price in Soybeans market goes up since September 2018. There is a very good possibility to fill the gap to 1020.

March Bean Oil H&SMarch Bean Oil is building out what looks like a head and shoulders. Dropped today and heading for neckline at 29.73 to finish off the head. Right shoulder top needs to be formed before any trade can be entered.

SOYBEANS! pre-Wasde run down. volatile fun timethank the lord and pass the ammunition post shutdown this will be one of the first main agriculture reports to come out. i favor a bearish sentiment but we've been flying blind for sometime due to lack of data coming out. weather and supply surpluses via Brazilian competitors also back the bearish thesis longer term. either way this is going to be a volatile but fun market to trade. it is linked to current trade conditions. if a deal isnt struck Brazilian competition will be favored due to currency/interest rate differential effects on DXY

SOYBEAN FUTURES (MAR 2019), 1D, CBOTTrading Signal
Short Position (EP) : 918.5
Stop Loss (SL) : 921.5
Take Profit (TP) : 912.25, 904
Description
ZSH2019 formed Double Repo Sell at 1d time frame. Trade setup with Sell Stop at 0.382 Level (918.5) and place stop after 0.618 level (921.5). Once the position was hit, place take profit before an agreement (912.25) and 904
Money Management
Money in portfolio : $1,000,000
Risk Management (0.5%) : $5,000
Position Sizing
$0.25 = +-$12.5/std-contract
Commission fee = -$5.64/std-contract
EP to SL = $3 = -$150
Contract size to open = 33 standard contracts
EP to TP#1 = $6.25 = +$312.5
EP to TP#2 = $14.5 = +$725
Expected Result
Commission Fee = -$186.12
Loss = -$4950
Gain#1 = +$5,312.5
Gain#2 = +$11,600
Total Gain = +$16,912.5
Risk/Reward Ratio = 3.26


Week Plan - Bullish but not chasing breakoutIs forming a flat top triangle which looks like it is going to break out to the POC above.
However this does not mean buy the breakout, I am only interested in going long from below the value area low. It looks like it's choppy at the high vol area right below the breakout zone so this is an especially bad place to buy for a long.
Looking for it to run stop to the downside, will look for long at value area low which then gives it a target at the POC.
Looking for longs around 834'6

November Corn call will bring in some handsome profitsExpect a little pullback here then higher. To buy a call on the pull back will bring some handsome profits
