XC1! trade ideas

July Corn SellSold July corn when volume increased over May Corn giving a triple top on the continuous contract. Turned out to be not a bad move, plus May failed to penetrate the 382 on the 240 chart indicating temporary support

July Corn Bullish GartelyJuly Corn is nearing the 20 day MA. This line will either be support or will be breached. We expect breach. Turn around expected at S2 as that will put RSI oversold and produce a Gartley pattern. We should see tonight what the corn people think of direction.


Corn update - Temporarily shortWent long 375'3 last week and closed out position when failed to cross 392.5 high on the daily with a 12 point profit
Now short at 387.125 but only temporarily as main trend is still pointing up.
More needs to shorted if 384 is broken

Long Corn againWent long 375 after crossing swing high and holding above swing lows indicating higher prices. Question is if it can take out the old highs now?

Once Corn couldn't hold up there anymore, this happened...US Corn, commodities, was flirting with high prices for quite some time. 3 days ago, it struggled passing the 392 mark.
This was a good sign for traders that it was resisting to move further.
2 days later it collapsed to 372.

May Corn Crosses 20 Day MAMay Corn has crossed over the 20 day MA and could be setting up a Bullish Gartely pattern. Next downside target pivot at 376'6. S1 at 369 is the overall target. RSI has turned bearish. Resistance comes in at 387'4.


Corn - prepare for lower pricesFirst swing low broken by 3 cents or more so time to cover and go short until a swing high is broken again

Corn 2 day brice movesImportant to monitor the 2 day swing chart in conjunction with the daily trend chart to find import support and resistance points


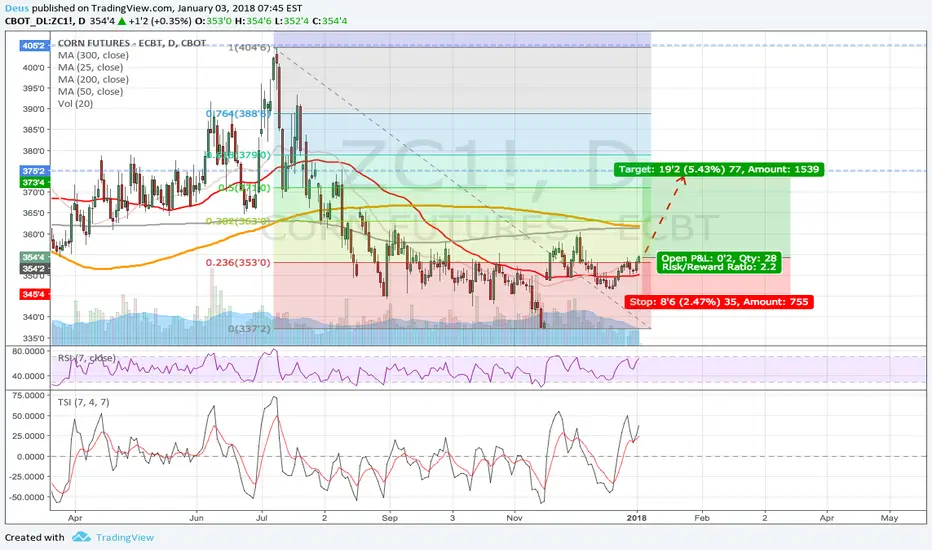
Bullish falling wedge for Corn Future ZC1!With a Bulish falling wedge forming in D1 chart and recent upturn momentum as parabolic volume pattern after breakout day on 29/11/2017,
there is an high oppotunity for Conr Future ZC1! to breakout of wedge starting a long-term bull stage.
Trading strategies:
Go long ZC1! at 358.4, target at 391, stop loss at 354


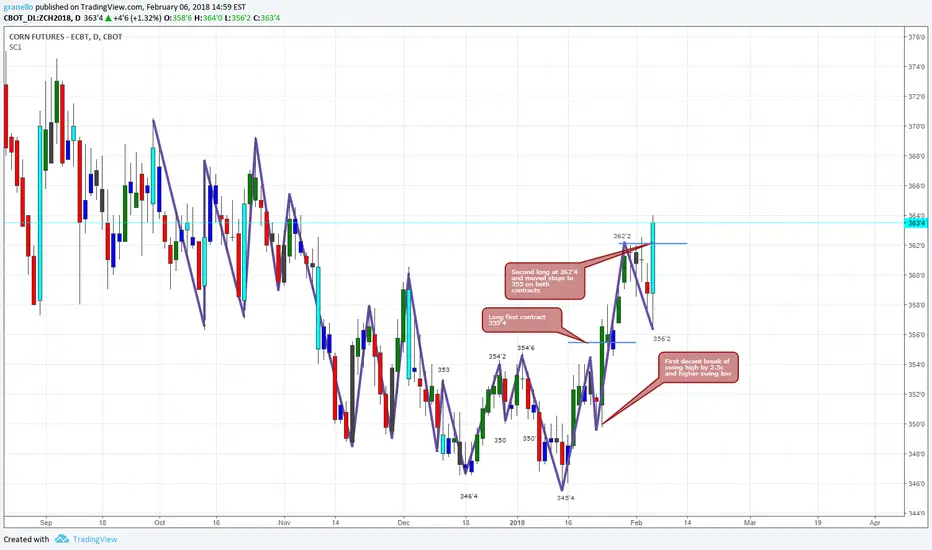
Finally movement in CornFirst time we have broken a swing high since this contract went active, crossed 354'6 by 2.5c. We crossed by 2.5c back in December but back then the December contract was active.

Corn H&S ChannelMarch Corn head and shoulders setup to bottom of channel and possibly beyond to S3 at 338'6.

ZC : Tentatively bullish- Technical: in a range between 340 - 360, in the middle of the BB
-CoT: Commercial reduced there Longs a bit, thus fabvouring rising prices
- seasonal trend: neutral until February, than March rally
- Fundamental: high demand, but also ample suppy. This will favour the range for the next month
Summary: will wait for USDA report on Friday.
Then probably will sell OTM Puts on May Corn, at around 330.

Corn and other Soft Grains look Bullish 2018 $ZC_F interest rates going higher, enjoy the pull of inflation for your grains, that and colder weather forecast forget global warming, how about the cooling that is reality?

Corn bounced off 1x2 angleFriday we saw corn bounce off the 1x2 angle and should head towards the 1x1 angle for a sell opportunity.

