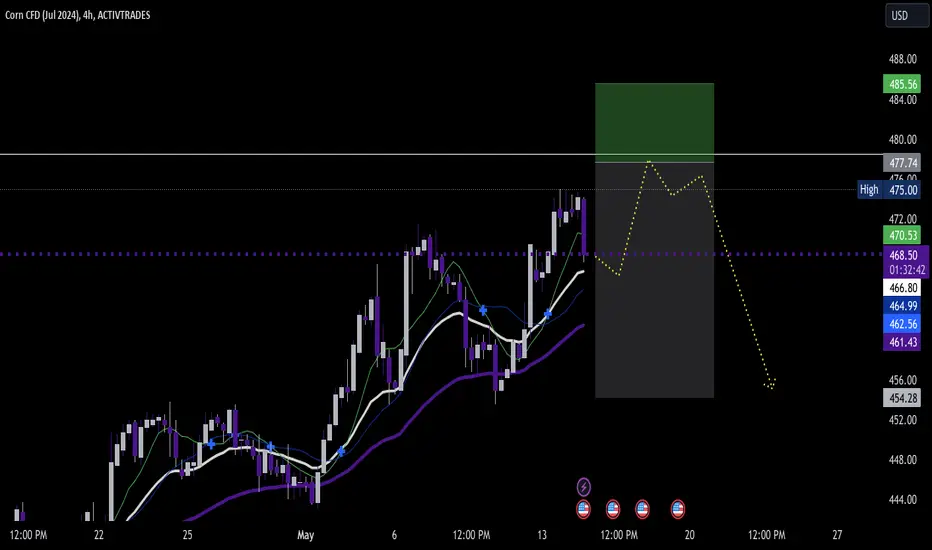
A Counter Trend Trade Setup for Corn Futures?
Corn
Technicals (July)
July corn futures notched their sixth consecutive session with a lower close, the longest losing streak since February. We see weakness again in the early morning trade, but the intraday lows from Monday are still intact, which is actually encouraging considering the better-than-expected crop ratings report we got earlier in the week. 433-436 continues to be the support pocket we are keeping an eye on, this pocket is really where the market started carving out a meaningful short-term low in March and April. From a risk/reward perspective, we believe this pocket set's up for a nice counter trend trade. A break and close below that support pocket would neutralize that thesis, but if the Bulls can defend it, we could see the market seek relief and gravitate towards our pivot pocket from 448-451.
Bias: Neutral/Bullish
Resistance: 460 1/4-463 1/2***, 471-474 3/4****
Pivot: 448-451
Support: 433-436****
Check out CME Group real-time data plans available on TradingView here: www.tradingview.com
Disclaimers:
CME Real-time Market Data help identify trading set-ups and express my market views. If you have futures in your trading portfolio, you can check out on CME Group data plans available that suit your trading needs www.tradingview.com
*Trade ideas cited above are for illustration only, as an integral part of a case study to demonstrate the fundamental concepts in risk management under the market scenarios being discussed. They shall not be construed as investment recommendations or advice. Nor are they used to promote any specific products, or services.
Futures trading involves substantial risk of loss and may not be suitable for all investors. Trading advice is based on information taken from trade and statistical services and other sources Blue Line Futures, LLC believes are reliable. We do not guarantee that such information is accurate or complete and it should not be relied upon as such. Trading advice reflects our good faith judgment at a specific time and is subject to change without notice. There is no guarantee that the advice we give will result in profitable trades. All trading decisions will be made by the account holder. Past performance is not necessarily indicative of future results.
XC1! trade ideas

Bearish Corn Futures Technical & Fundamental ThesisIn this video I go over my technical and fundamental thesis on why I think corn futures are bearish. For example, I go over good planting progress, quality ratings of corn, good weather and demand concerns from the energy side of things and even Chinese imports of corn. I also go over the technical side of things and notice technical patterns like head and shoulders and a rolling over shift of trend on renko charts. I hope you enjoy and stay tuned for more!
CBOT:ZC1! CBOT_MINI:XC1! AMEX:CORN

Cornhusker
All ideas are strictly my interpretation of price action. I am not a professional trader nor is this
professional advice.

Corn,Price actions didnt hold up last week..Hello fellow traders , my regular and new friends!
Welcome and thanks for dropping by my post.
Turning bearish on this one..wheat could be as well..it seems like trying to push lower with the toppish pattern that you are seeing on h4...
Do check out my recorded video (in trading ideas) for the week to have more explanation in place.
Do Like and Boost if you have learnt something and enjoyed the content, thank you!
-- Get the right tools and an experienced Guide, you WILL navigate your way out of this "Dangerous Jungle"! --
*********************************************************************
Disclaimers:
The analysis shared through this channel are purely for educational and entertainment purposes only. They are by no means professional advice for individual/s to enter trades for investment or trading purposes.
*********************************************************************

Corn and Wheat to look for long...why?Hello fellow traders , my regular and new friends!
Welcome and thanks for dropping by my post.
Why? will share my thoughts in my trading analysis this week.
Technical wise yes,part of it.
Do check it out ;)
Do check out my recorded video (in trading ideas) for the week to have more explanation in place.
Do Like and Boost if you have learnt something and enjoyed the content, thank you!
-- Get the right tools and an experienced Guide, you WILL navigate your way out of this "Dangerous Jungle"! --
*********************************************************************
Disclaimers:
The analysis shared through this channel are purely for educational and entertainment purposes only. They are by no means professional advice for individual/s to enter trades for investment or trading purposes.
*********************************************************************

Throwing CornAll ideas are strictly my interpretation of price action. I am not a professional trader nor is this
professional advice.
I will continually update all trades.

Corn ShortContinued downside on corn amid supply issues.
Nice clear technical downtrend with volume profiles confirming direction with P-shape and POC at lows of days indicating price acceptance continues to move lower.
Price rejecting off previous swing low, 50% fib retracement with EMA confirming trend.
Possible entry on break through counter trendline and target at previous swing low or previous volume cave.

Wheat and Corn Thoughts In this video I go over my recent thoughts, ideas and reasoning for the Wheat and Corn markets. We question the narrative about the recent rallying and try to be as data dependent as possible by keeping up with news and data and some critical thinking. I hope you enjoy and stay tuned for more!
CBOT:ZW1! CBOT:ZC1!

Falling cobsAll ideas are strictly my interpretation of price action. I am not a professional trader nor is this
professional advice.
I will continually update all trades.
Corn Futures:Evaluating Seasonal Trends Amidst Market VolatilityAs April unfolds, investors and traders in the corn futures market find themselves at a critical juncture marked by seasonal trends and heightened volatility. Historically, April has been a period of growth in corn prices, driven by various factors including planting intentions, weather conditions, and demand patterns. However, the current landscape presents a complex picture influenced by a myriad of geopolitical, climatic, and logistical disruptions.
While the overall corn production from key sources such as the US, Brazil, Argentina, and Ukraine has remained relatively stable, the market has experienced significant turbulence. Geopolitical conflicts, including trade disputes and tensions in key producing regions, have added layers of uncertainty, impacting supply chains and trade dynamics. Severe weather events, ranging from droughts to floods, have disrupted planting schedules and crop yields, further exacerbating market volatility. Additionally, transport issues, including congestion at ports and logistical bottlenecks, have contributed to fluctuations in day-to-day prices and overall market sentiment.
Amidst this backdrop, market participants are actively seeking long setups, anticipating a potential upswing in corn prices. Historical data indicating seasonal strength in April provides a compelling rationale for such positions. Moreover, underlying factors such as resilient demand from sectors including animal feed, ethanol production, and food processing continue to support a bullish outlook for corn.
However, navigating the corn futures market requires careful consideration of both macroeconomic factors and micro-level dynamics. Traders must remain vigilant in monitoring weather forecasts, geopolitical developments, and supply chain disruptions for timely decision-making. Additionally, leveraging technical analysis tools and risk management strategies can help mitigate the impact of market volatility and optimize trading opportunities.
In conclusion, while April historically heralds a period of price growth in corn futures, the current environment characterized by heightened volatility necessitates a nuanced approach to trading. By combining an understanding of seasonal trends with a comprehensive assessment of market fundamentals and risk factors, traders can position themselves to capitalize on potential opportunities while managing inherent uncertainties.

🔥Corn Returm Bullish Trend🔥The corn market is buzzing with positive signals today , promising strong profit potential for investors. Our assessment is spot on as corn prices are exhibiting a robust recovery trend. Across all key timeframes - 4 hours, 1 day, and 1 hour - the upward trend is evident, presenting golden opportunities for investors to seize.
Particularly noteworthy is the emergence of a compelling Order Block resistance zone on the 1-hour chart. This resistance zone signifies significant illiquidity at a specific price level, highlighting it as an ideal buying point to ride the upward trend.
Based on our in-depth analysis, we strongly believe that this is an opportune moment for investors to initiate long positions in corn. The Order Block resistance zone on the 1-hour chart serves as a key to unlocking near-term profits.
BUY LMT ZCEN24:
Entry: 444''0
STP: 439''6
TP: 458

Corn Futures Bullish But With Skepticism... In this video, I'm analyzing Corn Futures (CBOT:ZC1!) with a bullish but skeptical outlook due to incomplete data. While factors like potential rain delays in the US corn belt and dry weather impacting Brazil's second corn crop suggest upside potential, I need further confirmation. Additionally, A slowdown in manufacturing could also reduce demand for corn-based products, adding another layer of bearish pressure also the recent weakness in oil (NYMEX:CL1!) and rising US oil inventories are concerning. This could dampen demand for energy markets, potentially spilling over to ethanol (a major corn user) and weakening corn demand. Overall, there are potential bullish catalysts, but I need a clearer picture before going long.

Options Blueprint Series: Debit Spreads - Precision InvestingIntroduction to Options on Corn Futures
Corn Futures are one of the staple commodities traded on the Chicago Board of Trade (CBOT), representing a critical component of the agricultural sector's financial instruments. Each Corn Futures contract is standardized to 5,000 bushels, and the price is quoted in USD-cents per bushel.
Contract Specifications:
Point Value: 1/4 of one cent (0.0025) per bushel = $12.50.
Margins: Trading on margin allows traders to leverage positions while only needing to cover a fraction of the total contract value. For Corn Futures, the initial margin requirement is set by the CME Group and varies based on market volatility: Currently $1,300 per contract at the time of this publication.
Options trading introduces another layer of complexity and opportunity. Debit spreads involve purchasing one option and selling another, which helps manage the overall cost of entering the market.
Margin for Debit Spreads:
The margin for debit spreads typically reflects the premium paid for the long position minus any premium received from the short position. This results in a significantly lower margin requirement compared to trading the underlying futures contract outright. (In the below example the net premium paid for the spread is 7.26 points = $363, which is significantly lower than $1,300).
Understanding Debit Spreads
Debit spreads are a sophisticated options trading strategy utilized primarily to achieve a targeted investment outcome while managing risk exposure. They are constructed by purchasing an option (call or put) while simultaneously selling another option of the same type (call or put) but with a different strike price, within the same expiration period. The aim is to reduce the net cost of the position, as the premium received from the sold option offsets part of the cost incurred from the bought option.
Mechanics of Debit Spreads:
Long Position: You buy an option that you expect to increase in value as the market moves in your favor.
Short Position: You sell another option with a higher strike (in the case of a call spread) or a lower strike (in the case of a put spread). This option is expected to expire worthless or decrease in value, offsetting the cost of the long position.
Advantages of Using Debit Spreads:
Defined Risk: The maximum loss on a debit spread is limited to the net premium paid plus transaction costs. This makes it easier to manage risk, especially in volatile markets.
Potential for Profit: Although the profit potential is capped at the difference between the strike prices minus the net debit paid, these spreads can still offer attractive returns relative to the risk undertaken.
Lower Cost of Entry: Compared to buying a single option, spreads typically require a lower upfront investment, making them accessible to a wider range of traders.
This strategic application is what we'll explore next in the context of Corn Futures, where market conditions suggest a potential breakout.
Application in Corn Futures
For traders looking to harness the volatility in the agricultural sector, especially in commodities like corn, debit spreads can be a precision tool for structured trading. Given the current trading range of Corn Futures, with prices oscillating between 424 cents and 448 cents per bushel for a number of weeks, a strategic setup can be envisioned aiming for an upward breakout towards 471 cents, a resistance level indicated by Sell UnFilled Orders (UFOs).
Strategy Implementation with Debit Spreads:
Long Call Option: Buying a call option with a strike price near the lower end of the current range (450) positions traders to benefit from potential upward movements. Premium paid is 10.39 ($519.5)
Short Call Option: Simultaneously, selling a call option with a strike price at 475 cents caps the maximum profit but significantly reduces the cost of entering the trade. This strike is chosen because it aligns closely with the expected UFO resistance level, enhancing the probability of the short option expiring worthless. Premium received is 3.13 ($156.5).
The net cost of the spread ($519.5 - $156.5 = $363) represents the total risk. We are using the CME Group Options Calculator in order to generate fair value prices and Greeks for any options on futures contracts.
Setting up the Trade
To potentially capitalize on the anticipated market movement for Corn Futures, our debit spread strategy will involve a detailed setup of options trades based on specific strike prices that align with market expectations and technical analysis. This step-by-step guide will provide clarity on how to effectively enter and manage this options strategy.
Trade Details:
Long Call Option: Buy a call option with a strike price of 450. This option is chosen as it is near the current upper boundary of the trading range, providing a favorable entry point as we anticipate a breakout.
Short Call Option: Sell a call option with a strike price of 475. This strike is selected based on its proximity to the identified resistance level at 471, suggesting a high likelihood that the price may not exceed this level before expiration.
Cost and Profit Analysis:
Net Premium Paid: $363 as discussed above.
Break-even Point: Long strike price (450) plus the net premium paid = 457.26.
Maximum Profit: The maximum profit for this debit spread is capped at the difference between the two strike prices minus the net premium paid = 475 – 450 – 7.26 = 17.74 = $887.
Maximum Loss: The maximum risk is limited to the net premium paid.
Risk Management
By entering a debit spread, traders not only define their maximum risk but also set clear targets for profitability based on established market thresholds. This methodical approach ensures that even if the anticipated price movement does not fully materialize, the financial exposure remains controlled.
Risk Management Techniques:
Position Sizing: Determine the appropriate size of the position based on overall portfolio risk and individual risk tolerance.
Stop-Loss Orders: Although the maximum loss is capped by the nature of the debit spread (the net premium paid), stop-loss orders can be used if the underlying asset moves against the trader.
Rolling the Spread: If market conditions change or the initial price target is reached earlier than expected, consider 'rolling' the spread.
Adjusting the Trade:
If the price of Corn Futures approaches the short strike price (475) faster than anticipated, and market sentiment indicates further upward potential, the short call option can be bought back while a new higher strike call can be sold. This adjustment aims to extend the profitable range of the spread without increasing the original risk by much.
Conversely, if the price seems unlikely to reach the 450 mark, reassess the viability of keeping the spread open. It may be prudent to close the position early to preserve capital if fundamental market factors have shifted negatively.
Importance of Continuous Monitoring:
Regularly monitor market conditions, including factors like weather reports, agricultural policies, and economic indicators that significantly impact corn prices.
Stay updated with technical analysis charts and adjust strategies according to new resistance and support levels identified.
Effective risk management not only protects from downside risk but also enhances the potential for profitability by adapting to changing market conditions.
Conclusion
The strategic use of debit spreads in Corn Futures options trading offers a balanced approach to leverage market opportunities while maintaining strict control over potential risks.
Recap of Key Points:
Corn Options on Futures: Understanding the contract specifics is crucial for informed trading decisions.
Debit Spreads: These allow traders to benefit from expected price movements with reduced upfront costs and limited risk.
Trade Setup: Focused on a potential breakout from the 448-424 range aiming towards 471, utilizing 450 and 475 strikes for the long and short calls respectively.
Risk Management: Emphasizes the importance of position sizing, potential use of stop-loss orders, and the flexibility to adjust or roll the spread according to market changes.
When charting futures, the data provided could be delayed. Traders working with the ticker symbols discussed in this idea may prefer to use CME Group real-time data plan on TradingView: www.tradingview.com This consideration is particularly important for shorter-term traders, whereas it may be less critical for those focused on longer-term trading strategies.
General Disclaimer:
The trade ideas presented herein are solely for illustrative purposes forming a part of a case study intended to demonstrate key principles in risk management within the context of the specific market scenarios discussed. These ideas are not to be interpreted as investment recommendations or financial advice. They do not endorse or promote any specific trading strategies, financial products, or services. The information provided is based on data believed to be reliable; however, its accuracy or completeness cannot be guaranteed. Trading in financial markets involves risks, including the potential loss of principal. Each individual should conduct their own research and consult with professional financial advisors before making any investment decisions. The author or publisher of this content bears no responsibility for any actions taken based on the information provided or for any resultant financial or other losses.

Can Corn Futures Stage a Spring Rally?We've shifted our focus to the July futures contracts as the volume starts to increase there and decrease in May futures. May options expiration is this Friday, which means first notice day is next week. If you're in May futures, you may consider exiting or rolling those positions.
Corn
Technicals (July)
July corn futures have traded on both sides of unchanged as we start a new week of trade. The fact that the Bulls were able to defend support late last week is a silver lining for the Bull camp, but upside expectations are likely tempered as it continues to be a mostly sideways trade over the last month. The sideways trade isn't a great environment for the perma-bull or perma-bear, but it's great for shorter term traders, on both sides of the market.
Bias: Bullish/Neutral
Resistance: 441 3/4-444 1/2***, 449 1/2-451****
Pivot: 431 1/2-435
Support: 433 1/4-436****, 422 1/4-424 1/4***
Fund Positioning
Friday’s Commitment of Traders report showed that Funds were net sellers of about 16k contracts (through 4/16/24), that puts their net short position at 279,570. Broken down that is 161,576 longs VS 441,146 shorts.
Seasonal Trends
(Past performance is not necessarily indicative of future results)
Check out this link to review the chart.
bluelinefutures.com
Below is a look at price averages for December corn, using the 5, 10, 15, 20, and 30 year averages. We update this each Monday. If you'd like to look at different contract months, spreads, etc, let us know and we can send those charts to you.
Check out Blue Line Futures
bluelinefutures.com
Email info@Bluelinefutures.com or call 312-278-0500 with any questions -- our trade desk is here to help with anything on the board!
Futures trading involves substantial risk of loss and may not be suitable for all investors. Therefore, carefully consider whether such trading is suitable for you in light of your financial condition. Trading advice is based on information taken from trade and statistical services and other sources Blue Line Futures, LLC believes are reliable. We do not guarantee that such information is accurate or complete and it should not be relied upon as such. Trading advice reflects our good faith judgment at a specific time and is subject to change without notice. There is no guarantee that the advice we give will result in profitable trades. All trading decisions will be made by the account holder. Past performance is not necessarily indicative of future results.
Blue Line Futures is a member of NFA and is subject to NFA’s regulatory oversight and examinations. However, you should be aware that the NFA does not have regulatory oversight authority over underlying or spot virtual currency products or transactions or virtual currency exchanges, custodians or markets. Therefore, carefully consider whether such trading is suitable for you considering your financial condition.
With Cyber-attacks on the rise, attacking firms in the healthcare, financial, energy and other state and global sectors, Blue Line Futures wants you to be safe! Blue Line Futures will never contact you via a third party application. Blue Line Futures employees use only firm authorized email addresses and phone numbers. If you are contacted by any person and want to confirm identity please reach out to us at info@bluelinefutures.com or call us at 312- 278-0500

Corn recouping early week loses and setting up a test of 3-star.Corn
Technicals (May)
May corn futures tested the low end of the range in yesterday's trade and have so far been able to defend it, with prices working back higher in the overnight and early morning trade. We still like the risk reward trade to the buy side from the low end of the range. A break and close support would neutralize that bias as it could put the Bears back in complete control of the technical landscape.
Bias: Bullish/Neutral
Resistance: 441 3/4-444 1/2***, 447 1/2-450****
Pivot: 431 1/2-435
Support: 421-422***
Fund Positioning
Friday’s Commitment of Traders report showed that Funds were net sellers of about 4k contracts (through 4/9/24), that puts their net short position at 263,554. Broken down, that is 158,480 longs VS 422,034 shorts.
Seasonal Trends
(Past performance is not necessarily indicative of future results)
Below is a look at price averages for December corn, using the 5, 10, 15, 20, and 30 year averages.
Check out CME Group real-time data plans available on TradingView here: www.tradingview.com
Disclaimers:
CME Real-time Market Data help identify trading set-ups and express my market views. If you have futures in your trading portfolio, you can check out on CME Group data plans available that suit your trading needs www.tradingview.com
*Trade ideas cited above are for illustration only, as an integral part of a case study to demonstrate the fundamental concepts in risk management under the market scenarios being discussed. They shall not be construed as investment recommendations or advice. Nor are they used to promote any specific products, or services.
Futures trading involves substantial risk of loss and may not be suitable for all investors. Trading advice is based on information taken from trade and statistical services and other sources Blue Line Futures, LLC believes are reliable. We do not guarantee that such information is accurate or complete and it should not be relied upon as such. Trading advice reflects our good faith judgment at a specific time and is subject to change without notice. There is no guarantee that the advice we give will result in profitable trades. All trading decisions will be made by the account holder. Past performance is not necessarily indicative of future results.

A Stick In The MudCorn
Technicals (May)
What more is there to say about the corn market that hasn’t been said already? The market remains range bound with daily ranges shrinking as of late, reminiscent of watching paint dry. The CME CVOL index which measures volatility remains near the low end of the years range. Typically, we start to see that increase this time of year, but perhaps we need to get the May contract into delivery to liven things up. On that same topic, trade volume is starting to shift out from the May contract to July, with first notice day just under two-weeks away.
Bias: Bullish/Neutral
Resistance: 441 3/4-444 1/2, 447 1/2-450*
Pivot: 431 1/2-435
Support: 421-422***
Fund Positioning
Friday’s Commitment of Traders report showed that Funds were net sellers of about 4k contracts (through 4/9/24), that puts their net short position at 263,554. Broken down that is 158,480 longs VS 422,034 shorts.
Seasonal Trends
(Past performance is not necessarily indicative of future results)
Below is a look at price averages for December corn, using the 5, 10, 15, 20, and 30 year averages.
Check out CME Group real-time data plans available on TradingView here: www.tradingview.com
Disclaimers:
CME Real-time Market Data help identify trading set-ups and express my market views. If you have futures in your trading portfolio, you can check out on CME Group data plans available that suit your trading needs www.tradingview.com
*Trade ideas cited above are for illustration only, as an integral part of a case study to demonstrate the fundamental concepts in risk management under the market scenarios being discussed. They shall not be construed as investment recommendations or advice. Nor are they used to promote any specific products, or services.
Futures trading involves substantial risk of loss and may not be suitable for all investors. Trading advice is based on information taken from trade and statistical services and other sources Blue Line Futures, LLC believes are reliable. We do not guarantee that such information is accurate or complete and it should not be relied upon as such. Trading advice reflects our good faith judgment at a specific time and is subject to change without notice. There is no guarantee that the advice we give will result in profitable trades. All trading decisions will be made by the account holder. Past performance is not necessarily indicative of future results.

CBOT corn ends down on favorable US weatherChicago Board of Trade corn futures ended lower on Monday, pressured by generally favorable U.S. weather for planting and a setback in crude oil futures as worries eased about escalating tensions in the Middle East.
-Corn sometimes follows trends in crude oil due to its role as the main U.S. feedstock for ethanol fuel.
-CBOT May corn settled down 4 cents at $4.31-12 per bushel.
-U.S. Department of Agriculture (USDA) confirmed private sales of 165,000 metric tons of U.S. corn to Mexico, including 135,000 tons of old-crop corn and 30,000 tons of new-crop corn.
-The USDA reported export inspections of U.S. corn in the latest week at 1,331,683 metric tons, in line with trade expectations for 1,200,000 to 1,500,000 tons.

Corn Prices To Fire Up on Rising Energy CostsIt is official. Inflation is back. But not everywhere. Food inflation is on the decline. All three major crops, Soybean, Wheat, and Corn have declined substantially. Bearish sentiments rings loud across agri with ample supplies combined with solid harvest expectations.
Among crops, corn has fared best. Its prices have not declined as much. Corn outlook is positive given South American supply uncertainty and gasoline linked demand spike.
Corn prices face downside risk from ample supply in the near term. Prices have the potential to spike during later part of the year due to supply uncertainty and higher consumption.
Traders can deploy a calendar spread in CME Corn futures comprising of a short September 2024 Corn Futures (ZSU2024) and a long March 2025 Corn Futures (ZSH2025) to gain from shifting dynamics.
RECORD US CROP WILL SUPPRESS NEAR TERM CORN PRICE
The US produced a record 389.69 million MT of corn last year as per latest USDA figures. Massive production is a result of record high yield of 177.3 bushels per acre.
Globally, corn production in the current marketing year is expected to reach a record 1,227 million MT, due to the US crop last year.
Higher supply is expected to lead to a buildup in ending stocks. Stocks are expected to increase from 302.19 million MT to 318.28 million MT. This represents a buildup of almost 16 million MT.
Ample supplies are a headwind to near term corn prices.
USDA ESTIMATES MAY BE TOO OPTIMISTIC
Global corn production forecasts by USDA may be too optimistic. Upcoming harvests from Brazil and Argentina may spring surprises to the downside.
USDA’s forecast for the Brazil corn crop is currently at 124 million MT. Brazil’s national agricultural agency - CONAB - puts the harvest at 110.9 million MT as per their latest crop survey . The difference stems from USDA’s assumption of higher planted area.
CONAB recently cut its estimate for planted area pointing to lower crop prices dissuading farmers from planting corn. Planting in Brazil is delayed from its usual schedule.
USDA is also optimistic about the Argentinian crop. It reduced its forecast for Argentinian corn by 1 million MT to 55 million MT in the latest WASDE report. However, that is still optimistic given the ongoing spread of spiroplasma disease. Last week, Argentina’s Rosario Exchange slashed corn estimates to just 50.5 million MT from a previous forecast of 57 million MT citing crop loss linked with diseases.
USDA estimates are 18 million MT higher than harvest forecasted by regional agencies across Brazil & Argentina. Corn supplies may end up being much tighter than the USDA is currently forecasting if harvests come softer than anticipated.
ETHANOL PRODUCTION IS LIKELY TO INCREASE CORN CONSUMPTION
USDA increased its forecast for corn consumption for ethanol production by twenty-five million bushels (635k MT) in the latest WASDE report. With gasoline and crude prices on a tear, ethanol blending into gasoline is likely to remain elevated during the coming months driving corn demand.
Sustainable Aviation Fuel (SAF) serves as another source of corn demand in 2024. The Biden Administration is set to release its primary climate model for SAF subsidies under the Inflation Reduction Act in the “very near future”.
While recent reports have stated that the model may be restrictive compared to corn-ethanol industry expectations, the subsidies will undoubtedly drive higher demand for corn-ethanol.
CORN FUTURES CONTANGO IS STEEPENING
Corn Futures term structure has become noticeably steeper over the past three months. Premium for dated contracts have increased. Specifically, corn delivery in later part of 2024 and early 2025 command higher premium.
MARKET METRICS ARE TURNING LESS BEARISH FOR CORN
CME Corn Options positions are currently skewed bullish with a put/call ratio of 0.84. Over the past week, bullish positioning has increased with large call option buildup on June (OZCN4) and December contracts (OZCZ4).
Asset managers have also started to reduce net short positioning on CME Corn Futures since positioning reached its all-time low mid-February.
HYPOTHETICAL TRADE SETUP
South America corn supply remains uncertain even as the US delivers a record harvest. Corn prices will remain bearish in the near term amid ample supplies. Longer term, supply shocks and rising demand has the potential to send corn prices higher. This is evident from steepening contango in CME Corn Futures.
To express the view on corn prices increasing towards the end of the year, traders can establish a calendar spread comprising of short position in September 2024 futures (ZCU2024) and a long position in March 2025 futures (ZCH2025). CME corn futures offer deep liquidity even for contracts in 2025 allowing such calendar spreads to be executed efficiently.
A hypothetical trade setup comprising of the calendar spread consisting of short ZCU2024 and long ZCH2025 also offers margin benefits. The calendar spread position is margin efficient with the entire position requiring margin of just USD 350 as of 15/April/2024.
This position not only benefits from the supply trend but also the seasonal trend in corn prices. Corn prices tend to rise from October through February due to seasonal factors. Between April to September, prices tend to decline. This hypothetical spread is supported by both trends.
• Entry: 1.06185 (ZCH2025/ZCU2024 = 485/456.75 as of 12/April)
• Target: 1.076
• Stop Loss: 1.052
• Profit at Target: USD 323 (Target price = 1.33% higher than Entry => Profit = 1.33% x notional = 1.33% x (485 x Contract Size) = 1.33% x (485 x 5000/100))
• Loss at Stop Loss: USD 225 (Stop level = 0.93% below entry => Loss = 0.93% x notional)
• Reward to Risk: 1.44x
MARKET DATA
CME Real-time Market Data helps identify trading set-ups and express market views better. If you have futures in your trading portfolio, you can check out on CME Group data plans available that suit your trading needs www.tradingview.com
DISCLAIMER
This case study is for educational purposes only and does not constitute investment recommendations or advice. Nor are they used to promote any specific products, or services.
Trading or investment ideas cited here are for illustration only, as an integral part of a case study to demonstrate the fundamental concepts in risk management or trading under the market scenarios being discussed. Please read the FULL DISCLAIMER the link to which is provided in our profile description.

CBOT corn lower on good Midwest planting weather outlookChicago Board of Trade corn futures dropped to a one-month low on Tuesday on forecasts for good spring planting weather in the U.S. Midwest that could potentially increase acres planted this spring.
-Concerns about ample supplies and weak U.S. corn export demand added further pressure to prices after a media report said Chinese authorities were seeking to curb some imports.
-CBOT May corn ended 9 cents lower at $4.26-1/2 a bushel after touching its lowest point since March 6.
-Corn was pressured by forecasts for good planting weather in the heart of the U.S. Midwest corn belt later this month following rains this week. Good early season weather tends to support more corn planting.
-The market rallied last week after the U.S. Department of Agriculture (USDA) forecast smaller-than-expected U.S. corn plantings.
-The USDA late on Monday said 2% of the U.S. corn crop was planted as of Sunday, in line with trade estimates.

Just Another Corn Video In today's video I just go over some of my general thoughts about the corn market and some of its current technical and fundamental factors that I believe are driving the market. Hope you enjoy and stay tuned for more! :)
CBOT:ZC1! CBOT_MINI:XC1! AMEX:CORN

Grain Futures Gain GroundGrain futures are higher in the early morning trade as some as headline risk looms into the weekend.
Corn
Technicals (May)
May corn futures are fractionally lower in the early morning trade as prices linger near our pivot pocket from 431 1/2-435, which just happens to be right near the middle of first support and first resistance. We like the upside potential in corn but some of the deferred contracts have a more friendly technical landscape than the May.
Bias: Bullish/Neutral
Resistance: 441 3/4-444 1/2***, 447 1/2-450****
Pivot: 431 1/2-435
Support: 421-422***
Fund Positioning
Friday’s Commitment of Traders report showed that Funds were net sellers of about 8k contracts (through 4/2/24), that puts their net short position at 259,556.
Seasonal Trends
(Past performance is not necessarily indicative of future results)
Below is a look at price averages for December corn, using the 5, 10, 15, 20, and 30 year averages.
Technicals (May)
May soybean futures are fractionally higher in the early morning trade. Support from 1170-1175 will continue to be very important for the Bulls to defend through this week's trade. A break and close below could spark another wave of pressure. On the resistance side of things, they want to see a close above resistance from 1198-1205 1/2.
Bias: Neutral/Bullish
Resistance: 1198-1205 1/2***, 1212 3/4-1216***
Pivot: 1187
Support: 1170-1175***, 1161-1167****
Fund Positioning
Friday's Commitment of Traders report showed Funds were net sellers of roughly 3.5k contracts, trimming their net short position to 138,256 contracts.
Seasonal Trends
(Past performance is not necessarily indicative of future results)
Below is a look at price averages for November soybeans, using the 5, 10, 15, 20, and 30 year averages.
Wheat
Technicals (May)
Wheat futures broke out above trendline resistance last week which adds to the recent trend of higher highs and higher lows. If the Bulls can achieve a close above resistance from 568 1/2-570 we could see it open the door for an extension towards the psychologically and technically significant $6.00 level.
Bias: Neutral/Bullish
Resistance: 568 1/2-570***, 595 3/4-600***, 608 1/2-611**
Pivot: 550-555
Support: 525**
Seasonal Trends
(Past performance is not necessarily indicative of future results)
Below is a look at price averages for July wheat, using the 5, 10, 15, 20, and 30 year averages. Historically this isn't the most friendly time of year.
Check out CME Group real-time data plans available on TradingView here: www.tradingview.com
Disclaimers:
CME Real-time Market Data help identify trading set-ups and express my market views. If you have futures in your trading portfolio, you can check out on CME Group data plans available that suit your trading needs www.tradingview.com
*Trade ideas cited above are for illustration only, as an integral part of a case study to demonstrate the fundamental concepts in risk management under the market scenarios being discussed. They shall not be construed as investment recommendations or advice. Nor are they used to promote any specific products, or services.
Futures trading involves substantial risk of loss and may not be suitable for all investors. Trading advice is based on information taken from trade and statistical services and other sources Blue Line Futures, LLC believes are reliable. We do not guarantee that such information is accurate or complete and it should not be relied upon as such. Trading advice reflects our good faith judgment at a specific time and is subject to change without notice. There is no guarantee that the advice we give will result in profitable trades. All trading decisions will be made by the account holder. Past performance is not necessarily indicative of future results.

Options Blueprint Series: Leveraging Diagonals with Corn FuturesIntroduction to Corn Futures (CBOT)
Corn Futures, central to the commodities market, are traded on the Chicago Board of Trade (CBOT). These futures contracts are standardized agreements to buy or sell 5,000 bushels of corn, providing traders with a mechanism to hedge against price changes or to be exposed to future price movements in the agricultural sector.
Contract Specifications:
Contract Size: 5,000 bushels
Quotation: Cents per bushel
Minimum Tick Size: ¼ cent per bushel, equivalent to $12.50 per contract
Trading Hours: Sunday to Friday, electronic trading from 7:00 PM to 7:45 AM CT, and Monday to Friday, daytime trading from 8:30 AM to 1:20 PM CT
Contract Months: March, May, July, September, December, with additional serial months providing year-round trading opportunities
Margin Requirements: Margins are set by the exchange and can vary, with initial margins typically being a fraction of the contract value to secure a position ($1,300 at the time of this publication)
The liquidity and volume in Corn Futures make them an attractive market for traders. Factors influencing corn prices include weather patterns affecting crop yields, global supply and demand dynamics, and changes in energy prices due to corn's role in ethanol production.
Understanding Diagonal Spreads
Diagonal Spreads are a sophisticated options strategy that involves simultaneously buying and selling options of the same type (either calls or puts) with different strike prices and expiration dates. This approach is designed to leverage the time decay (theta) and volatility differences between contracts, making it particularly suitable for markets with expected directional moves and distinct volatility characteristics, like Corn Futures.
Key Components:
Long Leg: Involves buying an option with a longer expiration date. This option acts as the foundational position, typically chosen to be in-the-money (ITM) to capitalize on intrinsic value while also benefiting from time decay at a slower rate due to its longer duration.
Short Leg: Consists of selling an option with a shorter expiration date and a different strike price, usually out-of-the-money (OTM). This leg generates immediate income from the premium received, which helps offset the cost of the long leg.
Strategic Advantages:
Directional Flexibility: Diagonal spreads can be tailored to bullish or bearish outlooks depending on the selection of calls or puts, strikes and expirations.
Time Decay Harnessing: By selling a shorter-term option, the strategy aims to benefit from the rapid acceleration of time decay on the sold option, improving the position's overall theta.
Given the cyclical nature of the agricultural sector and the specific factors influencing corn prices, diagonal spreads offer a strategic method to trade Corn Futures options. They provide a balance between long-term market views and short-term income generation through premium collection on the short leg.
Application of Diagonal Spreads to Corn Futures
In applying Diagonal Spreads to Corn Futures, we focus on a bearish strategy to capitalize on an anticipated gap fill below the current price level. This strategic choice is driven by the analysis of Corn Futures' price action, indicating potential downward movement. A bearish diagonal spread can be particularly effective in such scenarios, offering the flexibility to benefit from both time decay and directional movement.
Bearish Diagonal Spread Setup:
Long Leg (Buy Put): Select a put option with a longer expiration date to serve as the foundation of your bearish position. Choose a strike price that is at-the-money or in-the-money (ATM/ITM) to ensure intrinsic value.
Short Leg (Sell Put): Sell a put option with a shorter expiration date at a lower strike price that is out-of-the-money (OTM).
Trade Example:
Assumption: Corn Futures are trading at 434 cents per bushel.
Long Put: Buy a 47-day put option with a strike price of 435 cents, paying a premium of 7.49 cents per bushel ($374.5 – point value =$50).
Short Put: Sell a 19-day put option with a strike price of 415 cents, receiving a premium of 1.01 cents per bushel ($50.5 – point value =$50).
As seen on the below screenshot, we are using the CME Options Calculator in order to generate fair value prices and Greeks for any options on futures contracts.
The goal is for Corn Futures to decline towards the 415-cent level (origin of the gap).
Risk Considerations: While diagonal spreads can offer controlled risk (premium paid = 6.48 = 7.49 – 1.01 = $324 – point value =$50) and strategic flexibility, it's crucial to be mindful of the potential for loss, particularly if the market moves sharply in an unintended direction. Employing risk management techniques can help mitigate these risks:
Adjustments and Rolls: Proactively manage the position by adjusting or rolling the short leg to a different strike price or expiration date in response to market movements or changes in volatility. This can help collect additional premium and potentially offset losses on the long leg.
Use of Stop Losses: Implement stop-loss orders based on predefined risk tolerance levels. This could be set as a percentage of the initial investment or based on the technical levels in Corn Futures prices.
Diversification: While not specific to the strategy, diversifying your portfolio beyond just Corn Futures options can help manage overall market risk. Different markets may react differently to the same economic indicators or geopolitical events, spreading your risk exposure.
Regular Monitoring: Given the dynamic nature of Corn Futures and the options market, regular monitoring is crucial. Stay informed about market conditions, news impacting agricultural commodities, and changes in volatility that could affect your position.
Diagonal spreads in Corn Futures offer a strategic avenue for traders looking to exploit market conditions and time decay with a defined risk profile. However, the key to successful implementation lies in diligent risk management, including making informed adjustments, employing diversification, and maintaining a disciplined approach to monitoring and exiting positions.
Conclusion
In this edition of the Options Blueprint Series, we explored the strategic application of Diagonal Spreads to Corn Futures traded on the Chicago Board of Trade (CBOT). This advanced options strategy offers traders a nuanced approach to potentially capitalize on market movements, leveraging the inherent time decay of options to enhance potential returns.
Employing Diagonal Spreads allows traders to express a directional bias—bearish, in our case study—while managing the investment's risk profile through a combination of long-term and short-term options. By buying a longer-dated, in-the-money put and selling a shorter-dated, out-of-the-money put, traders can set up a position that benefits from both the expected downward movement towards a gap fill and the accelerated time decay of the sold option.
However, as with any sophisticated trading strategy, understanding and managing the associated risks is paramount. Directional risks, volatility changes, and the potential for early assignment on the short leg require vigilant management and a readiness to adjust the position as market conditions evolve.
By adhering to disciplined risk management practices—such as making timely adjustments, employing stop losses, and maintaining portfolio diversification—traders can seek to navigate the complexities of the options market and aim for consistent, strategic gains.
The Corn Futures market, with its dynamic price movements influenced by a range of factors from weather to global supply and demand dynamics, provides a fertile ground for applying Diagonal Spreads. Traders who invest the time to understand both the underlying market and the intricacies of this options strategy may find themselves well-positioned to exploit opportunities that arise from market volatility.
In summary, Diagonal Spreads present a strategic option for traders looking to leverage market insights and options mechanics in pursuit of their trading objectives. As always, education and practice are key to mastering these techniques, with paper trading offering a risk-free way to hone one's skills before venturing into live markets.
When charting futures, the data provided could be delayed. Traders working with the ticker symbols discussed in this idea may prefer to use CME Group real-time data plan on TradingView: www.tradingview.com This consideration is particularly important for shorter-term traders, whereas it may be less critical for those focused on longer-term trading strategies.
General Disclaimer:
The trade ideas presented herein are solely for illustrative purposes forming a part of a case study intended to demonstrate key principles in risk management within the context of the specific market scenarios discussed. These ideas are not to be interpreted as investment recommendations or financial advice. They do not endorse or promote any specific trading strategies, financial products, or services. The information provided is based on data believed to be reliable; however, its accuracy or completeness cannot be guaranteed. Trading in financial markets involves risks, including the potential loss of principal. Each individual should conduct their own research and consult with professional financial advisors before making any investment decisions. The author or publisher of this content bears no responsibility for any actions taken based on the information provided or for any resultant financial or other losses.

Are December Corn Futures Set for a Rally to $5.00?December corn futures, often referred to as the “new crop” contract because it is the price for the U.S. crop that is about to get planted. The first crop progress report of the year showed just 2% of the crop is planted in the United States. With the crop hardly in the ground, there are uncertainties around production potential that tend to offer seasonal support to prices.
The seasonal backdrop coupled with a potential shift in momentum through the month of March may offer a good risk/reward trade to the upside. As you can see on the chart 480-485 has been a significant pocket dating back to last May, where it first acted as support. It eventually was the breakdown point on January 12th and has acted as resistance since then. If the market can chew through and achieve consecutive closes above this pocket, we believe it could spark additional upside momentum with the next significant resistance pocket coming in near $5.00 -5.06, which is both technically and psychologically significant. As you can see on the chart this was a congestion zone through the back half of last year and represents the 50% retracement (middle of the range) from last summer’s high to the year’s low. There’s also a small gap at 503 from January 2nd.
Looking at the weekly Commitment of Traders report we see funds holding a net shot position of 259,556 futures/options contracts, this would historically be looked at as a large net short position, especially for this time of year. Closes above technical resistance could spark short covering and add an additional tailwind to the market. A break and close below the recent lows of 460 ¾ would neutralize this bullish bias.
Check out CME Group real-time data plans available on TradingView here: www.tradingview.com
Disclaimers:
CME Real-time Market Data help identify trading set-ups and express my market views. If you have futures in your trading portfolio, you can check out on CME Group data plans available that suit your trading needs www.tradingview.com
*Trade ideas cited above are for illustration only, as an integral part of a case study to demonstrate the fundamental concepts in risk management under the market scenarios being discussed. They shall not be construed as investment recommendations or advice. Nor are they used to promote any specific products, or services.
Futures trading involves substantial risk of loss and may not be suitable for all investors. Trading advice is based on information taken from trade and statistical services and other sources Blue Line Futures, LLC believes are reliable. We do not guarantee that such information is accurate or complete and it should not be relied upon as such. Trading advice reflects our good faith judgment at a specific time and is subject to change without notice. There is no guarantee that the advice we give will result in profitable trades. All trading decisions will be made by the account holder. Past performance is not necessarily indicative of future results.
