BON16Sorry for the late post shorted this couple days ago. Looking for price to reach the 32.60ish level. Stops are moved into profit as of this afternoon. Hopefully by Friday we have a solid move down.
XK1! trade ideas

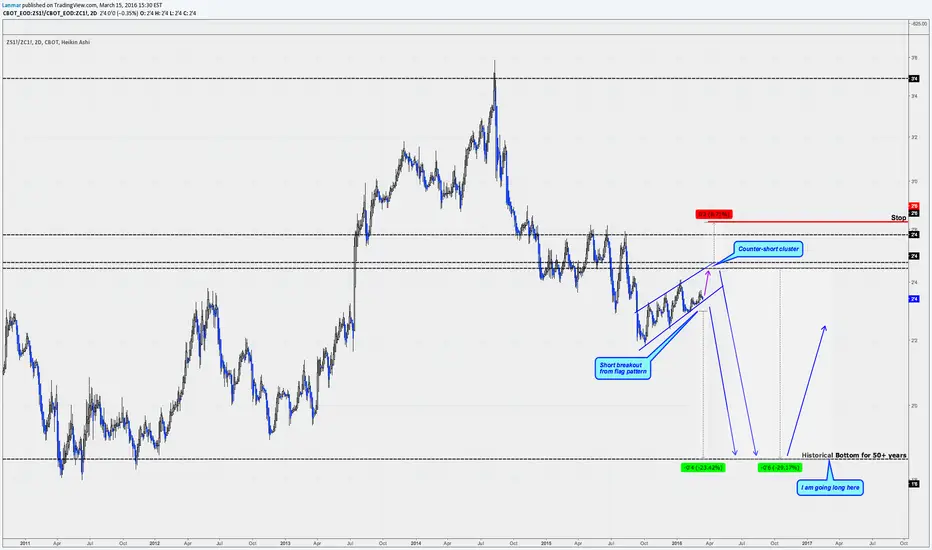
Short Soybeans against Corn long termThe soybean/corn spread presents a great opportunity to short into historical lows.


Soybeans breaking up after accumulation Soybeans today gapped up after friday closed obove the broken trendline. Im going long here because softs are way behind metals and energy, black line is comparing with commodity index

Soybeans: Some Upside Action Might Finally Be HereComments on the chart. Lookout for the idea on the daily chart as well

WATCHINGSOYBEAN IS EXACTLY ON S/R TREND LINE AND WITH BULLISH TRIGGER FOR EXAMPLE CANDLE I WILL ENTER TO BUY POSITION AND SELL AFTER BREAKOUT IS THE OTHER POSSIBILITY

Possible bottom in MayWith the break of the trend line, red lines are targets untill May. This bottom will be an important one for many years to come.

Short Setup and Trade for Soybean CBOTI have my own trading system depending on only numbers and dependin on my system it said short. I only want to publish here to track my records and share with the public.

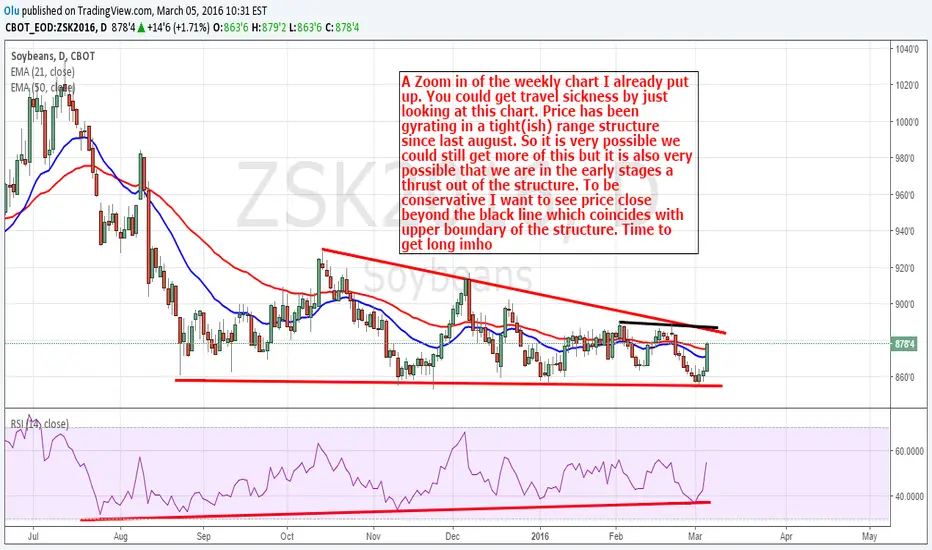
Soybeans weekly TAThe wave count in this chart differs from the one in the monthly. If this one holds true, we should be in W3:W5:W4, which is supposedly in a rectangle shape below the previous major support, which is now our major resistance (the red line). Daily analysis will give us a better understanding of the inner structure of the wave in making, and will hopefully provide us with a tradable picture.

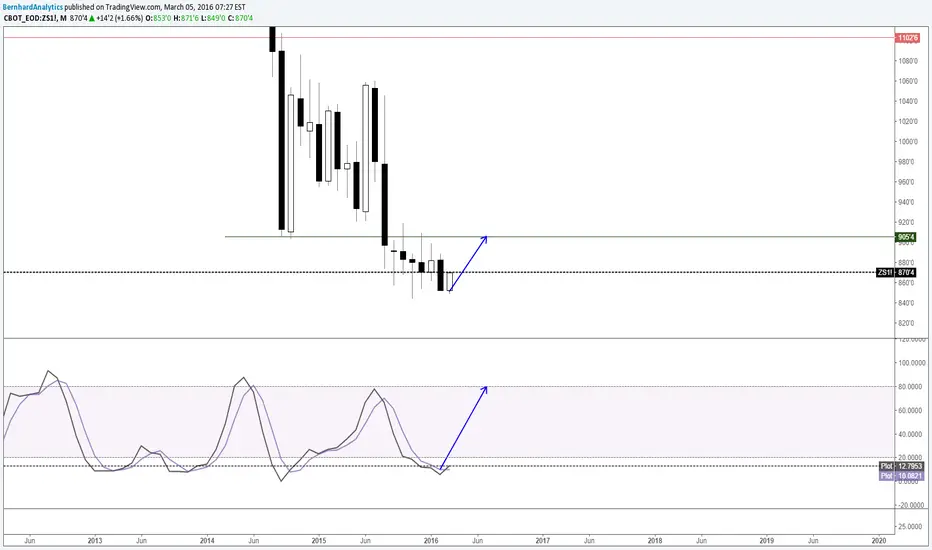
Soybeans monthly TAIt seems what W. D. Gann said some half a century ago still holds: "Soybeans is the king." Now this king is still away from a powerful support. It so seems that a 5-wave move is to be completed by the LMLH. Stoch seems quite happy and restful in the oversold zone. We are in the sixth narrow monthly bar, and technicians would love to see a NR7 breakout. But what I believe is that we have to be vigilant against a premature breakout, since it is also highly likely here. All in all my sentiment is bearish. And will be so until we see mid 700s.

Tick-tock-tick-tock flat line... maybe upWeekly:
- Absolutely dull. Major comment: "??????"
Daily:
- Neutral. Tightenning triangle
- Based on Heikin-Ashi signal, maybe up... but in fact it is still a noise.
Fun conclusion:
"Soybeans must be made of EURUSD" :-D


ZS looking more and more tempting.A little lower and Im not sure I could resist a low risk (punt).
If it doesnt, I will look to enter on a decisive break of the upper band of the L/T down channel.
Break of HZ support, will look to enter.
Still will be a great trade for 2016 either way


Still waitingAnother commod that looks like primed for a big move. Just waiting for the U$ to decide

Good morning Bulls and Bears!Wake up call. Is this trendline breaking? Are we going to see a bullish Kumo breakout within few days?
Anyhow, Heikin-Ashi signal and EWO is improving bullish .

No action in bearish channel since Aug/2015 Weekly:
- Huge bearish channel, but not much price action seen since Aug/2015
- Ichimoku setup is still bearish, strategic reversal level is ard 960
- Heikin-Ashi shows hesitation, with haDelta positive divergence
- EWO also have minor positive divergence
Daily:
- 855 key resistance worked again, price pops, making Ichimoku neutral
- Key reversal level (upper supp/res) is ard 880-890! Watch trendline, 100 WMA and Kumo!
- Heikin Ashi is bullish

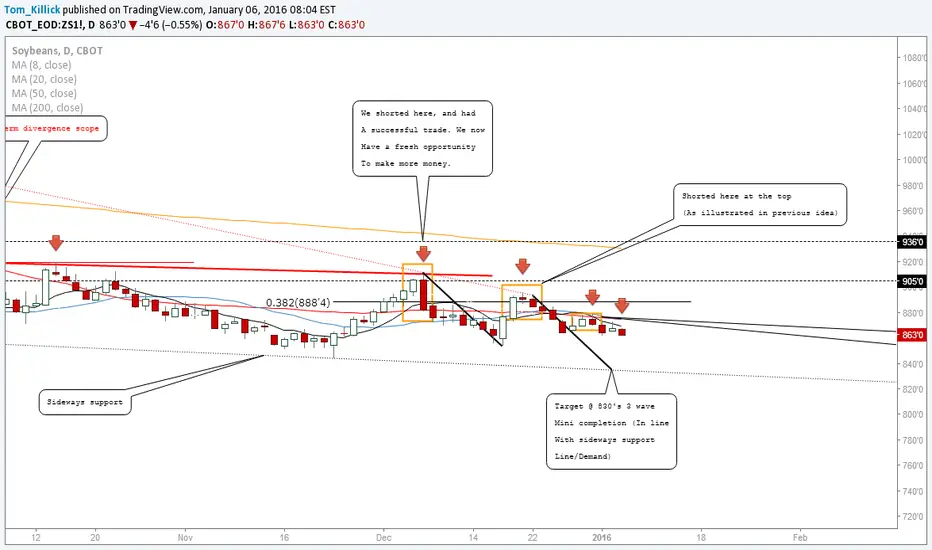
SOYBEANS: SHORTS FAVOURED AGAIN- SEEKING DEEPER MOVE #SOYTraders,
Update idea, we have made very nice money with Soybeans so well done to everyone who followed me on that idea, especially well done to those in my signal group who got this idea in realtime!, it went well. We are now looking into a continuation short to maximize our profits.
After a short recently, looking to short once again. We're at a good area, pinging off recent divergence, looking for a lower low hopefully. This would, in turn, ignite a deeper correction and give us some downside move.
Best of luck
Tom
---For online and face to face personalized tuition, and signals packages, message me here on Trading view, or message me with the email address on my Trading view profile page for discounts---
Soybeans at crucial dayCan it be the first AG to show any signs of life? Still remains heavily skewed towards downside

SOYBEANS: SHORTS FAVOURED AGAIN- SEEKING DEEPER MOVE #SOYTraders,
Update idea, we have made very nice money with Soybeans so well done to everyone who followed me on that idea, especially well done to those in my signal group who got this idea in realtime!, it went well. We are now looking into a continuation short to maximize our profits.
After a short recently, looking to short once again. We're at a good area, pinging off recent divergence, looking for a lower low hopefully. This would, in turn, ignite a deeper correction and give us some downside move.
Best of luck
Tom
NOTE: For online and face to face personalized tuition, and signals packages, message me here on Trading view, or message me with the email address on my Trading view profile page for discounts.
Thank you.
