Wheat ShortZW1! is now net short on the regression break.
The roll on this commodity short is (+3.7%) on the front month.
XWN2027 trade ideas

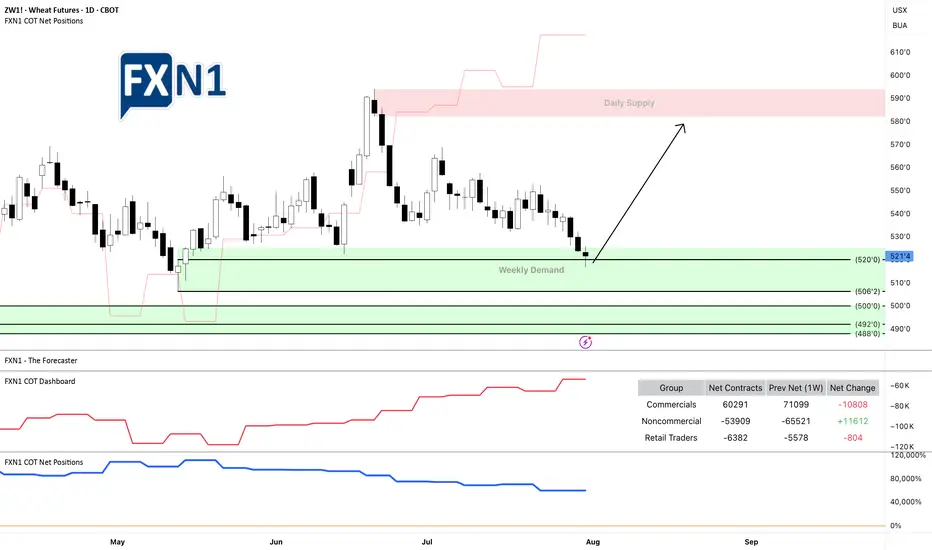
Is Wheat ZW1 Ready for a Long Trade? Key Demand Area InsightsThe futures of Wheat ZW1! are reaching a weekly demand zone, where we observe non-commercials going long and retail traders holding short positions. This could present a potential setup for a long trade. Note: There is another demand area below, but the positions of commercials are less clear compared to non-commercials and retail traders.
Always manage your risk carefully if you agree with my analysis, and be sure to develop your own trading plan.
✅ Please share your thoughts about ZW1! in the comments section below and HIT LIKE if you appreciate my analysis. Don't forget to FOLLOW ME; you will help us a lot with this small contribution.
Rain or Ruin? Analyzing Wheat Prices During Precip Extremes1. Introduction: When Rain Means Risk for Wheat Traders
Rain is life for wheat crops—until it isn’t. In the world of agriculture, water is essential, but extremes in precipitation can cause just as much harm as droughts. For traders in the wheat futures market, understanding this relationship between rainfall and price action is not just useful—it’s essential.
Wheat is a crop with a long growth cycle, grown across diverse geographies like the U.S. Plains, the Canadian Prairies, Russia, and Ukraine. Each region has its own precipitation rhythm, and any disruption can ripple through the global supply chain. The question is: can weather signals—especially rainfall—be used to predict market behavior?
This article dives into that question using a data-driven lens. We categorized precipitation data and measured how wheat futures returns responded to different rainfall environments. The results? Revealing, and at times, counterintuitive.
2. The Role of Rainfall in Wheat Production
Wheat, especially spring and winter varieties, is particularly sensitive to soil moisture levels at key phases like germination, tillering, and heading. Too little rain in early development and the crop can fail to establish. Too much rain close to harvest? Risk of disease, sprouting, and quality degradation.
Traders have long known that unexpected wet or dry weeks can trigger speculative surges or hedging activity. But how do these events influence actual futures returns?
Before answering that, we need to translate rain into something traders can use: categories based on historical norms.
3. Methodology: Categorizing Rainfall and Measuring Market Response
To understand how wheat prices respond to different levels of rainfall, we analyzed weekly precipitation data across global wheat-producing regions. We normalized the data using percentiles:
Low Precipitation: Below the 25th percentile
Normal Precipitation: Between the 25th and 75th percentiles
High Precipitation: Above the 75th percentile
We then matched this categorized weather data with weekly returns from wheat futures (symbol: ZW) to explore if price behavior systematically varied depending on how wet or dry a week had been.
To test significance, we used a simple t-test comparing the mean returns of low-precip and high-precip weeks. The p-value (6.995E-06) revealed a compelling result: yes, there is a statistically significant difference.
4. Results: High Rainfall, Higher Price Volatility
The data confirms that weeks with extreme rainfall—especially those with high precipitation—often align with more volatile wheat price movements.
But here’s the twist: while low-precip weeks didn’t consistently show bullish returns, high-precip weeks correlated with negative or erratic returns. That makes sense when you think about harvest delays, rot, and declining grain quality.
Traders watching forecasts for excessive rainfall should consider the implications for grain availability and price stabilization mechanisms. This is where speculative plays or hedging via options and standard or micro futures contracts can become especially useful.
5. Interpreting the Volatility: Why the Market Reacts to Rain
Why does excessive rain lead to such uneven price behavior?
The answer lies in uncertainty. Heavy rainfall often introduces multiple variables into the equation: planting delays, logistical bottlenecks, and downgraded wheat quality due to fungal infections. For example, a wet harvest can reduce protein content, pushing millers to seek alternatives—altering both demand and supply expectations simultaneously.
This dual-sided pressure—reduced high-quality yield and uncertain export capability—tends to shake market confidence. Traders respond not just to the supply data but also to how much trust they place in the supply pipeline itself.
6. Futures Contracts: Navigating Risk with Position Size Control
Traders looking to participate in wheat price action have two main CME-listed options:
Standard Wheat Futures (ZW)
Contract Size: 5,000 bushels
Tick Size: 1/4 cent per bushel (0.0025) has a $12.50 per tick impact
Margin Requirement: Approx. $1,700 (subject to change)
Micro Wheat Futures (MZW)
Contract Size: 500 bushels (1/10th the size of the standard contract)
Tick Size: 0.0050 per bushel has a $2.50 per tick impact
Margin Requirement: Approx. $170 (subject to change)
Micro contracts like MZW offer a lower-cost, lower-risk way to trade wheat volatility—perfect for sizing into weather-related trades with precision or managing risk in a more granular fashion. Many traders use these contracts to test strategies during seasonal transitions or while responding to forecast-driven setups.
7. Visual Evidence: Price Behavior by Precipitation Category
To visually represent our findings, we used box plots to show wheat weekly returns grouped by precipitation category:
The shape of these distributions is revealing. High-precipitation weeks not only show lower average returns but also a wider range of possible outcomes—underscoring the role that rainfall extremes play in price volatility rather than just directional bias.
We are also complementing this visual with a weather map that shows real-time precipitation patterns in major wheat-growing regions. This could help traders align weather anomalies with trading opportunities.
8. Final Thoughts: The Forecast Beyond Forecasts
Precipitation isn’t just an agricultural concern—it’s a market catalyst.
Our analysis shows that rainfall extremes, particularly heavy rain, create meaningful signals for wheat traders. The price response is less about direction and more about uncertainty and volatility, which is equally important when structuring trades.
If you’re serious about trading wheat futures, don’t just watch the charts—watch the clouds.
This article is one piece in our broader series on how weather influences ag futures. Stay tuned for the next one, where we continue to decode the atmosphere’s impact on the markets.
When charting futures, the data provided could be delayed. Traders working with the ticker symbols discussed in this idea may prefer to use CME Group real-time data plan on TradingView: www.tradingview.com - This consideration is particularly important for shorter-term traders, whereas it may be less critical for those focused on longer-term trading strategies.
General Disclaimer:
The trade ideas presented herein are solely for illustrative purposes forming a part of a case study intended to demonstrate key principles in risk management within the context of the specific market scenarios discussed. These ideas are not to be interpreted as investment recommendations or financial advice. They do not endorse or promote any specific trading strategies, financial products, or services. The information provided is based on data believed to be reliable; however, its accuracy or completeness cannot be guaranteed. Trading in financial markets involves risks, including the potential loss of principal. Each individual should conduct their own research and consult with professional financial advisors before making any investment decisions. The author or publisher of this content bears no responsibility for any actions taken based on the information provided or for any resultant financial or other losses.

WEAT making move?Wheat futures (ZW) have cleared a zone of resistance with a 4.6% one day move. As tracked by the WEAT ETF, current price seems to be heading for a retest of the 200 Daily SMA (currently at $4.90). The 200 Daily SMA has reversed previous attempts to break out in October 2024 and February 2025. Will third time be different?
Note that this ETF reached a high over $12 in 2022 when the Russian/Ukrainian war started.

Heatwaves and Wheat: How Temperature Shocks Hit Prices🌾 Section 1: The Wheat–Weather Connection—Or Is It?
If there’s one crop whose success is often tied to the weather forecast, it’s wheat. Or so we thought. For decades, traders and analysts have sounded the alarm at the mere mention of a heatwave in key wheat-producing regions. The logic? Excessive heat during the growing season can impair wheat yields by disrupting pollination, shortening the grain-filling period, or damaging kernel development. A tightening supply should lead to price increases. Simple enough, right?
But here’s where the story takes an unexpected turn.
What happens when we actually analyze the data? Does heat reliably lead to price spikes in the wheat futures market? The short answer: not exactly. In fact, our statistical tests show that temperature may not have the consistent, directional impact on wheat prices that many traders believe it does.
And that insight could change how you think about risk, seasonality, and the role of micro contracts in your wheat trading strategy.
📈 Section 2: The Economics of Wheat—And Its Role in the Futures Market
Wheat isn’t just a breakfast staple—it’s the most widely grown crop in the world. It’s cultivated across North America, Europe, Russia, Ukraine, China, and India, making it a truly global commodity. Because wheat is produced and consumed everywhere, its futures markets reflect a wide array of influences: weather, geopolitics, global demand, and speculative positioning.
The Chicago Board of Trade (CBOT), operated by CME Group, is the main venue for wheat futures trading. It offers two primary wheat contracts:
Standard Wheat Futures (ZW)
Contract Size: 5,000 bushels
Tick Size: 1/4 cent per bushel (0.0025) has a $12.50 per tick impact
Margin Requirement: Approx. $1,700 (subject to change)
Micro Wheat Futures (MZW)
Contract Size: 500 bushels (1/10th the size of the standard contract)
Tick Size: 0.0050 per bushel has a $2.50 per tick impact
Margin Requirement: Approx. $170 (subject to change)
These micro contracts have transformed access to grain futures markets. Retail traders and smaller funds can now gain precise exposure to weather-driven moves in wheat without the capital intensity of the full-size contract.
🌡️ Section 3: Weather Normalization—A Smarter Way to Measure Impact
When analyzing weather, using raw temperature values doesn’t paint the full picture. What’s hot in Canada might be normal in India. To fix this, we calculated temperature percentiles per location over 40+ years of historical weather data.
This gave us three weekly categories:
Below 25th Percentile (Low Temp Weeks)
25th to 75th Percentile (Normal Temp Weeks)
Above 75th Percentile (High Temp Weeks)
Using this approach, we grouped thousands of weeks of wheat futures data and examined how price returns behaved under each condition. This way, we could compare a “hot” week in Ukraine to a “hot” week in the U.S. Midwest—apples to apples.
🔄 Section 4: Data-Driven Temperature Categories and Wheat Returns
To move beyond anecdotes and headlines, we then calculated weekly percent returns for wheat futures (ZW) for each of the three percentile-based categories.
What we found was surprising.
Despite common assumptions that hotter weeks push wheat prices higher, the average returns didn’t significantly increase during high-temperature periods. However, something else did: volatility.
In high-temp weeks, prices swung more violently — up or down — creating wider return distributions. But the direction of these moves lacked consistency. Some heatwaves saw spikes, others fizzled.
This insight matters. It means that extreme heat amplifies risk, even if it doesn't create a reliable directional bias.
Traders should prepare for greater uncertainty during hot weeks — an environment where tools like micro wheat futures (MZW) are especially useful. These contracts let traders scale exposure and control risk in turbulent market conditions tied to unpredictable weather.
🔬 Section 5: Statistical Shock—The t-Test Revelation
To confirm our findings, we ran two-sample t-tests comparing the returns during low vs. high temperature weeks. The goal? To test if the means of the two groups were statistically different.
P-Value (Temp Impact on Wheat Returns): 0.354 (Not Significant)
Conclusion: We cannot reject the hypothesis that average returns during low and high temp weeks are the same.
This result is counterintuitive. It flies in the face of narratives we often hear during weather extremes.
However, our volatility analysis (using boxplots) showed that variance in returns increases significantly during hotter weeks, making them less predictable and more dangerous for leveraged traders.
🧠 Section 6: What Traders Can Learn from This
This analysis highlights a few key lessons:
Narratives aren’t always backed by data. High heat doesn’t always mean high prices.
Volatility increases during weather stress. That’s tradable, but not in the way many assume.
Risk-adjusted exposure matters. Micro wheat futures (MZW) are ideal for navigating weather-driven uncertainty.
Multi-factor analysis is essential. Weather alone doesn’t explain price behavior. Global supply chains, speculative flows, and other crops’ performance all play a role.
This article is part of a growing series where we explore the relationship between weather and agricultural futures. From corn to soybeans to wheat, each crop tells a different story. Watch for the next release—we’ll be digging deeper into more effects and strategies traders can use to capitalize on weather.
When charting futures, the data provided could be delayed. Traders working with the ticker symbols discussed in this idea may prefer to use CME Group real-time data plan on TradingView: www.tradingview.com - This consideration is particularly important for shorter-term traders, whereas it may be less critical for those focused on longer-term trading strategies.
General Disclaimer:
The trade ideas presented herein are solely for illustrative purposes forming a part of a case study intended to demonstrate key principles in risk management within the context of the specific market scenarios discussed. These ideas are not to be interpreted as investment recommendations or financial advice. They do not endorse or promote any specific trading strategies, financial products, or services. The information provided is based on data believed to be reliable; however, its accuracy or completeness cannot be guaranteed. Trading in financial markets involves risks, including the potential loss of principal. Each individual should conduct their own research and consult with professional financial advisors before making any investment decisions. The author or publisher of this content bears no responsibility for any actions taken based on the information provided or for any resultant financial or other losses.

Wheat Futures – Quick Update | May 28, 2025Wheat Futures – Quick Update | May 28, 2025
---
📈 Overview
Swing low formed at $5.06 on May 13 (capitulation volume spike)
Pullback to $5.26–5.28 now likely completed Wave 2 of a new impulse
Indecision candles (daily spinning top, 4 h dragonfly doji) signal exhaustion of selling
---
🔑 Key Technical Levels
Support:
Short term: $5.26–5.28
Medium term: $5.20
Long term floor: $5.06
Resistance:
Initial: $5.35–5.38 (50 EMA 4 h/1 h)
Next: $5.50–5.55 (daily 50 EMA 5.40, 200 EMA 5.58)
Stretch:$5.75–6.00
---
🧰 Indicator Snapshot
| Indicator | Short-Term Bias | Confirmation Needed |
| ---------------------- | --------------------- | ------------------------- |
| RSI (1 h/4 h) | Bullish divergence | Break above 60–65 |
| Momentum (4 h) | Turning up | Close >\$5.35 |
| Volume | Above-average on dips | Sustained rise on rallies |
| MACD (1 h) | Positive | 4 h bullish cross |
| Candlesticks | Spinning top / doji | Follow-through above high |
| Elliott Wave | New Wave 3 unfolding | Hold >\$5.26 |
| Fibonacci Time | .618 cycle low hit | Time window May 29–31 |
| Seasonality | Bullish into June | No new lows |
| COT Positioning | Commercial buying | Fund short covering |
| Intraday/Weekly Cycles | Early June turn | Break \~June 4–6 |
---
🎯 Trading Plan
1. Short-Term (1–5 days):
• Buy dips into $5.26–5.30
• Targets: $5.38 → $5.50
• Stop: $5.24
• R:R: 2:1
2. Medium-Term (1–3 weeks)
• Accumulate $5.20–5.28
• Targets: $5.57 → \$5.75
• Stop: Daily close < $5.20
3. Long-Term (1–2 months)
• Build core above $5.06
• Targets: $5.75–6.08 (1×–1.618× Wave 1)
• Stop: Weekly close < $5.00
---
📅 Outlook
Bullish continuation likely into early June if $5.26 holds
High-probability breakout above $5.35–5.38unlocks next leg toward $5.75+
Invalidation: Close below $5.20 delays rally toward lower retest
---
💡 Stay tuned for updates as we approach the May 29–31 cycle window.

The Comeback CarbAlright legends, this one’s for the patient degens we’re talking a long-term long in Wheat Futures. Not your usual 5-minute scalp. This is legacy portfolio material. The kind of trade where you're quietly stacking for a decade + ((Expected time to target ~700days))

Wheat Futures Under Pressure: Breakdown Near Key Support
Short-term trend: Bearish. Price is consistently making lower highs and lower lows since late February.
Medium-term trend: Also bearish, as confirmed by price staying below the midline of the Bollinger Bands.
Price is near the lower Bollinger Band, suggesting it is oversold in the short term. However, it has not shown signs of a strong reversal yet.
Volume is slightly above average on the most recent red candle, confirming bearish conviction.
Support Zone: Around 520'0 – psychologically and structurally important.

Wheat Trade ideaWheat has been in a downtrend for the past two years, but right now it’s sitting in a strong demand zone on the weekly chart for the year. Both the technicals and fundamentals are starting to look bullish, so this could be a solid setup for a long trade even if the overall trend is still down.
On Thursday, April 24, there was a nice daily rejection between the 545’00 and 539’00 levels. That would’ve been a good entry based on my strategy.
Most traders would avoid this kind of trade because of the strong downtrend, but I see everything lining up here: demand zone, fundamentals, and rejection. It doesn’t mean the market will reverse, but the risk is worth the potential reward.
I’m not expecting a huge move just taking what the market gives me. If fundamentals keep supporting the move, I’ll hold longer. If not, I’ll take profit earlier. It’s about staying realistic and disciplined.

Breadbasket Basics: Trading Wheat Futures🟡 1. Introduction
Wheat may be a breakfast-table staple, but for traders, it’s a globally sensitive asset — a commodity that reacts to geopolitics, climate patterns, and shifting demand from dozens of countries.
Despite its critical role in food security and its status as one of the most traded agricultural commodities, wheat is often overlooked by traders who focus on corn or soybeans. Yet wheat offers a unique combination of liquidity, volatility, and macro sensitivity that makes it highly attractive for both hedgers and speculators.
If you’re new to trading wheat, this guide gives you a solid foundation: how the wheat market works, who the key players are, and what makes wheat such a dynamic futures product.
🌍 2. Types of Wheat and Where It Grows
One of the first things traders need to understand is that wheat is not a single, uniform product. It’s a diverse group of grain types, each with its own characteristics, end uses, and pricing dynamics.
The major classes of wheat include:
Hard Red Winter (HRW): High-protein wheat grown in the central U.S. — used in bread and baking.
Soft Red Winter (SRW): Lower protein, used for pastries and crackers.
Hard Red Spring (HRS): Grown in the Northern Plains; prized for high gluten content.
Durum Wheat: Used for pasta, grown mainly in North Dakota and Canada.
White Wheat: Grown in the Pacific Northwest; used for noodles and cereals.
Each class responds differently to weather, demand, and regional risks — giving traders multiple ways to diversify or hedge.
Major global producers include:
United States
Russia
Canada
Ukraine
European Union
Australia
India
These regions experience different planting and harvesting calendars — and their weather cycles are often out of sync. This creates trading opportunities year-round.
🛠️ 3. CME Group Wheat Contracts
Wheat futures are traded on the Chicago Board of Trade (CBOT), part of the CME Group.
Here are the two key contracts:
o Standard Wheat
Ticker: ZW
Size = 5,000 bushels
Tick = 0.0025 = $12.50
Margin = ~$1,750
o Micro Wheat
Ticker: MZW
Size = 500 bushels
Tick = 0.0050 = $2.50
Margin = ~$175
Keep in mind that margins are subject to change — always confirm with your broker. Micro contracts are ideal for scaling in/out of trades or learning market structure without large capital risk.
📅 4. Wheat’s Seasonality and Supply Chain
Unlike corn or soybeans, wheat is planted and harvested across multiple seasons depending on the variety and geography.
In the U.S., winter wheat (HRW and SRW) is planted in the fall (September–November) and harvested in early summer (May–July). Spring wheat (HRS) is planted in spring (April–May) and harvested late summer.
Globally, things get even more staggered:
Australia’s wheat is harvested in November–December
Ukraine and Russia harvest in June–August
Argentina’s crop comes off the fields in December–January
This scattered global schedule means news headlines about one country’s weather or war (think Ukraine in 2022) can quickly shift sentiment across the entire futures curve.
📈 5. Who Trades Wheat and Why
Wheat is traded by a wide range of participants — each with their own objectives and strategies. Understanding their behavior can give you an edge in anticipating market moves.
Commercial hedgers:
Farmers lock in prices to protect against adverse weather or market crashes.
Grain elevators and exporters use futures to manage inventory risk.
Flour mills hedge their input costs to protect profit margins.
Speculators:
Hedge funds and CTAs trade wheat based on global macro trends, weather anomalies, or technical setups.
Retail traders increasingly use micro contracts to gain exposure to agricultural markets with lower capital risk.
Spread traders bet on pricing differences between wheat classes or harvest years.
🔍 For retail traders especially, micro contracts like XW open the door to professional markets without oversized exposure.
🧠 6. What Makes Wheat Unique in Futures Markets
Wheat is often considered the most geopolitically sensitive of the major grains. Here’s why:
Price can spike fast — even on rumor alone (e.g., export bans or missile strikes near ports).
Production risks are global — the market reacts not just to the U.S. crop, but to conditions in Russia, Ukraine, and Australia.
Storage and quality matter — protein levels and moisture content affect milling demand.
Unlike corn, wheat doesn’t have a single dominant industrial use (like ethanol). This means food demand is king, and food security often drives policy decisions that affect futures pricing.
📌 7. Summary / Takeaway
Wheat may not get as much media attention as corn or soybeans, but it’s a deeply important — and deeply tradable — market. Its global footprint, class differences, and sensitivity to weather and politics make it a must-know for serious agricultural futures traders.
Whether you're just starting out or looking to diversify your trading playbook, understanding wheat is an essential step. Learn its rhythms, follow its news, and respect the fact that every crop cycle brings a new story to the market.
🧭 This article is part of an ongoing educational series exploring futures trading in agricultural commodities.
📅 Watch for the next release: “Soybeans: The Global Protein Powerhouse.”
When charting futures, the data provided could be delayed. Traders working with the ticker symbols discussed in this idea may prefer to use CME Group real-time data plan on TradingView: www.tradingview.com - This consideration is particularly important for shorter-term traders, whereas it may be less critical for those focused on longer-term trading strategies.
General Disclaimer:
The trade ideas presented herein are solely for illustrative purposes forming a part of a case study intended to demonstrate key principles in risk management within the context of the specific market scenarios discussed. These ideas are not to be interpreted as investment recommendations or financial advice. They do not endorse or promote any specific trading strategies, financial products, or services. The information provided is based on data believed to be reliable; however, its accuracy or completeness cannot be guaranteed. Trading in financial markets involves risks, including the potential loss of principal. Each individual should conduct their own research and consult with professional financial advisors before making any investment decisions. The author or publisher of this content bears no responsibility for any actions taken based on the information provided or for any resultant financial or other losses.

Wheat Poised for a Seasonal Breakout – Key TechnicalsWheat Futures Update –
Focus: Spring Setup + Multi-Timeframe Convergence
📈 RSI
RSI on both 1H and 4H charts bounced from oversold in March and continues to rise. This shows improving momentum with no signs of overbought stress yet. Bullish divergence at the lows confirms the current rebound.
⚡️ Momentum
MACD and short-term oscillators have flipped up after a corrective dip. Momentum made a higher low alongside price, confirming a possible trend shift. The ADX is low but ticking up, hinting at a trend reawakening.
🔊 Volume
Big volume spikes occurred during March’s capitulation and early April’s rally — signs of accumulation. Pullbacks have had weaker volume, a bullish signal. A breakout above $5.55–$5.60 on rising volume would confirm a larger rally.
🕯 Candlesticks & Patterns
Bullish reversal candles formed at $5.17 and $5.25. Price is carving out higher lows and forming a falling wedge — bullish if price breaks out above $5.60. Support remains firm in the $5.20–$5.25 zone.
📊 Moving Averages
Short-term MAs (like 20 and 50 on the 1H) are curling up, while the 4H 50 MA is about to challenge the 200 MA. A golden cross could emerge if prices stay firm. We’re in a trend transition zone — watching for confirmation.
🌊 Elliott Wave
The March low likely marked the end of a 5-wave downtrend, and wheat may now be in the early stages of a new 5-wave uptrend. The rally to $5.69 counts as Wave 1, the dip to $5.25 as Wave 2. If valid, Wave 3 could target $6.00–$6.50.
⏳ Cycles
2024 likely marked the bottom of the 8-year wheat cycle. Shorter cycles suggest a rally into late Q2 or early Q3 is probable. Cycle timing aligns with seasonal tailwinds for May–June.
📅 Seasonality
Wheat tends to rally from April through June. We’re now entering the strongest seasonal window, historically associated with weather-driven price spikes. The recent pullback looks like a textbook seasonal buy.
📉 COT Positioning
Funds are still near record net short, while commercials (farmers, users) are heavily long — a classic contrarian bullish setup. Any positive catalyst could ignite a major short-covering rally. Sentiment remains max bearish, which is often bullish.
🌽 Wheat vs. Corn vs. Soybeans
Wheat offers the best risk/reward setup now. It’s technically basing with signs of reversal and has the most room to rally. Corn and soybeans look healthy too, but wheat is the laggard with the most explosive upside if it catches up.
🧮 Summary of Indicators (1H + 4H)
RSI: Rising ✅ Converging
Momentum (MACD): Turning up ✅ Converging
Volume: Accumulating ✅ Converging
Candlesticks: Bullish ✅ Converging
Moving Averages: Mixed ⚠️ Diverging
Elliott Wave: Uptrend start ✅ Converging
Cycles: Bullish phase ✅ Converging
Seasonality: Spring rally ✅ Converging
COT Positioning: Contrarian ✅ Bullish
🚨 Invalidates Bullish Setup If:
Price breaks below $5.17
Lower high forms under $5.50 and breaks $5.25
Bearish fundamental shock (e.g., supply surge)
Seasonality fails to lift price by June
📌 Trading Plan
Short-Term:
Buy dips $5.25–$5.35 or break above $5.60. Target $5.70–$6.00. Stop below $5.17.
Medium-Term:
Accumulate $5.20–$5.40. Target $6.00–$6.50 into summer. Stop below $5.00.
Long-Term:
Buy and hold in low $5s. Target $7–$8+ over 6–18 months. Stop < $4.80 or manage with small size.

Wheat / ZWN2025 / ZW1! - Price action at weekly supportWheat futures have had an interesting short-term price action character change, with a Higher-High printing on the H1. The price action is happening on a weekly level that has formed over the last year. Seasonality also favours wheat higher in the short term, although that is not the basis of this trade idea.
In anticipation of a Higher-Low forming on the H1 in this area around local support and the 61.8 fib level, there is a favourable RR trade in this area. I have decided to sell a put spread just below the market. I'm treating a break of the weekly level as a signal to manage the risk on the spread, with a first target at the daily swing high from two weeks ago. I will manage any trailing risk via the H4.

Wheat ShortZW1! futures is now net short on the regression break.
The roll on this (+2.6%) in the short direction

Will Dry Soil Lift Wheat's Price?Global wheat markets are currently experiencing significant attention as traders and analysts weigh various factors influencing their future price trajectory. Recent activity, particularly in key futures markets, suggests a growing consensus towards potential upward price movements. While numerous elements contribute to the complex dynamics of the grain trade, current indicators highlight specific supply-side concerns as the primary catalyst for this outlook.
A major force behind the anticipation of higher wheat prices stems from challenging agricultural conditions in significant production areas. The United States, a crucial global supplier, faces concerns regarding its winter wheat crop. Persistent dryness across key growing regions is directly impacting crop development and posing a material threat to achieving expected yields. This environmental pressure is viewed by market participants as a fundamental constraint on forthcoming supply.
Further reinforcing these concerns, official assessments of crop health have underscored the severity of the situation. Recent data from the U.S. Department of Agriculture revealed a winter wheat condition rating below both the previous year's level and average analyst expectations. This shortfall in anticipated crop health indicates a less robust supply picture than previously factored into market pricing, thereby increasing the likelihood of price appreciation as supply tightens relative to demand, even as other global factors like shifts in export prices from other regions introduce different market crosscurrents.

Start of the bullish multi year cycle Maybe witnessing the start of a multi year bullish cycle. Not only prior highs seem a great return, but the possibility of a giant cup and handle pattern up to the 200% extension seems a great in terms of risk vs reward

Wheat LongWheat ZW1! Futures are now net long.
The roll is negative (-2.5%) long. I am not taking this trade.

I've Cracked the Bullish Code in Chicago Wheat Using COTZW (Chicago Wheat) is setup for longs based on COT positioning and other fundamental indicators.

Wheat my papi guy they been breaking your ass too hard too longSo much pain in the eyes of the wheat papi. Last knife hurt me too you not alone my ass broken too. But its ok my flower guy now it's time for baguette in beras ass soon.
Now? Risky but I take it and see.

Wheat Crab Tell us about Talks.Wheat futures remain in a consolidation phase as market participants closely monitor developments in Russia-Ukraine negotiations, which could significantly influence global grain supply dynamics.
Meanwhile, technical analysis highlights a potential bullish signal, with the Crab harmonic pattern suggesting a possible price rebound from the 5,300 level.
Traders are advised to stay cautious, as geopolitical uncertainties and technical factors could lead to heightened volatility in the near term.

Still bullish sideI saw get liquidity, the price is not break the structure sell
HOwever, I still in bullish

Wheat Futures Under Pressure – Breakout or Breakdown ?
Higher red bars (selling volume) in recent declines indicate strong selling pressure.
Support Zone: Around 5400-5500 (recent lows, lower Bollinger Band).
Resistance Zone: Around 5800-6000 (upper Bollinger Band, previous swing highs).
A failure to hold above 5500 could lead to another retest of recent lows (5200-5300).


ZW! | InformativeCBOT:ZW1!
Buy at support and sell at resistance. This pattern has worked for over a year, and based on data analysis and trends, it will likely continue—easy profit.
