Did you weed out Wheat from your Portfolio?I see more of a buying opportunity coming up than a sell, though the latter is also possible.
Again, commodities trading is volatile so prepare your SL and capital management properly.
Trade cautiously.
XW1! trade ideas

ZW long due to everything's happening in the world right now, wheat is just as MANY markets is gonna get highly effected by the situation and it has showed that in the chart.
as we can see the price has had a really good volume, although it's rejected but it's only the start of a trend not the end of it or something, but one sure thing is that its effect is absolute and that rejection is gonna get the market to a point where it's gonna do a pullback to get some momentum and then to just get on the rocket.
this is the weekly chart so the profit is gonna be really good but the risk is higher so get a really good entry and hold on to it.

Food shortages entering back into playThe playbook for manoeuvring - actively adding longs
We can start with a quick review of the general plan for the operation I shall be discussing. I imagine all sitting in longs from earlier in the year are ready to exploit greater freedom of movement which we we will posses a tick above August highs. So to seize the point, our attack is a momentum move, like a sailing boat when we get caught in the wind.
Eyeballing a test of first targets at 900 as early as the yearly close. As can be seen from above, it would be quite wrong to describe these moves here as anything but painful for consumers. Depending on the price action at 900 we are flirting to unlock the GFC highs. We are 23% and counting, time to start swinging the bat!

ZW testing demarks yearly R1 pivot pointWheat futures ZW1! ran into strong resistance at Demarks Yearly R1 pivot point.

WHEAT FUTURESWheat every day gives a beautiful and powerful movement and respects the buttresses, the resistance, and the poison rose so rocket as we analysed it, and God willing to make good.

wheat zw futurWill we see new peaks in the wheat index? I think the price will reach a thousand dollars


Wheat Demand Increases / Swing Opportunity (Long)As can be seen on chart, quite a few positive indicators showing promise for the price of wheat during Q1 & Q2-2022.
Targets, support levels, RSI, Ult_MACD, Volume, Date Ranges and rhetoric can be seen on chart.
Good day!

WHEAT FUTURESWheat has moved and achieved the strong goal. It's now moving astonishingly over a really rugged support area.

analysis grafical for ZWZW t's going to know an upward wave.
So the procurement process has to start.


WHEAT FUTURESToday's wheat moves casually and faces a strong resistance zone from which it can bounce back strongly and descend into strong buttresses.


WHEAT FUTURESWheat moves after it has achieved the strong goal and Ada has penetrated the very strong summit will rise with the strength of Baden God.

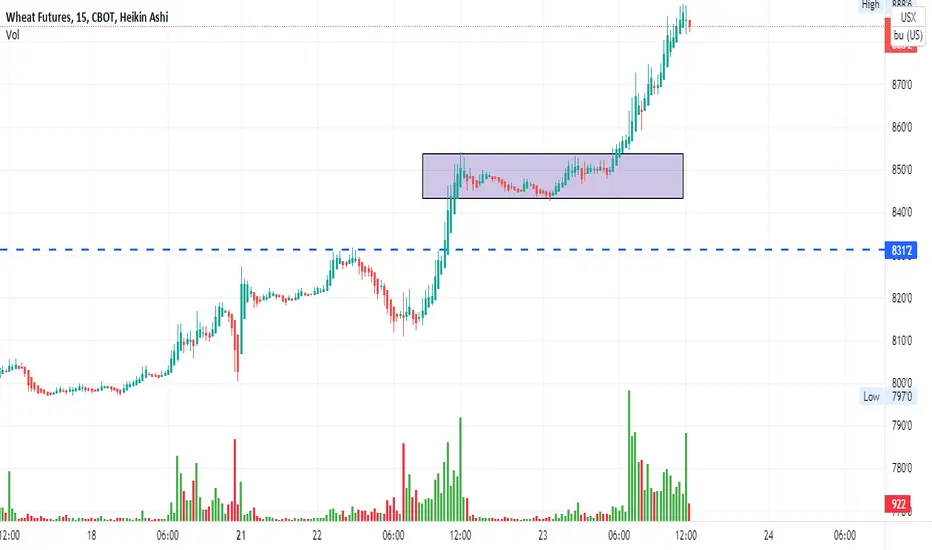
A minimum three-wave rally on Wheat Expected - Elliott wave WHEAT made a sharp and impulsive drop from the mentioned resistance levels, at Fib. ratio of 0.382/0.50 and at the level of a former wave iv (795/800 area). We labelled a possibly completed five-wave structure in C at 757 lvl., which means a minimum three-wave rally can now be in the cards, and is already underway.
If only a three-wave rally shows up, and then we see a new impulsive drop below the 757 lvl.. then this would suggest more weakness for a wave C.
If we get more impulsive price movement to the upside, and eventually above the upper parallel channel line, then this would suggest a bullish change in trend, and a completed red A-B-C correction.

WHEAT FUTURESWheat has brought us the target as strongly as it is made clear that there is more to give if God wishes.
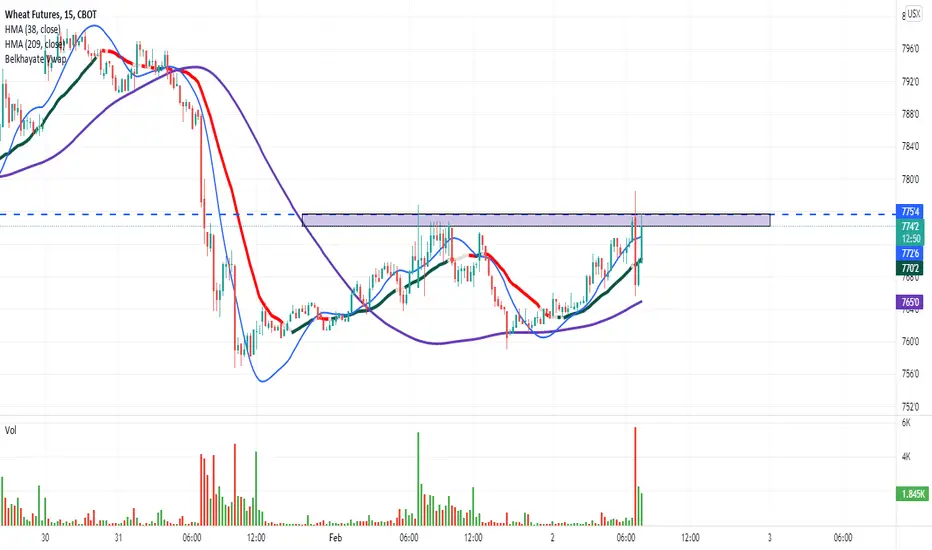
WHEAT Looks Promising - Elliott waveWHEAT (MAR 2022) made a textbook example of an impulsive (five legged) wave, down from 831 high, and found a potential low for a higher degree wave A or 1 at the 774 lvl.. Price can now be in a temporary, corrective retracement labelled as an a-b-c flat of a higher degree wave B or 2. Possible resistance is at fib. ratio of 0.382/0.50.
In case if price starts dropping impulsively through the lower corrective parallel channel line, and below the 774 low, then we would consider a completed correction in B or 2, and further weakness.

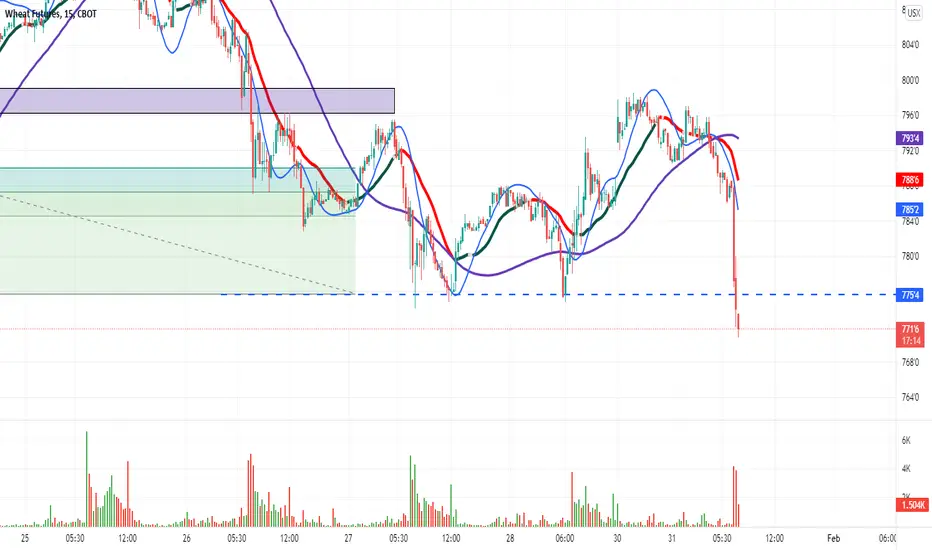
WHEAT in leg v of a bearish turn - Elliott waveWHEAT is trading in a five-wave decline for a higher degree wave 1 or A from 831 high. We also see that price broke below the lower corrective parallel channel line, which is a confirmation that a temporary high is in place, and a change in trend underway.
At the moment we are tracking a sub-wave v of 1/A, down from 795 lvl., where a corrective sub-wave iv had ended (fib. ratio of 0.382 and 0.50 reacted as resistance). Sub-wave v can reach area near the 776/771 lvls., before an a-b-c move for a bigger 2/B correction may follow.


WHEAT turning bearish for a lesser five-wave move - Elliott waveWHEAT (Mar 2022) is trading as expected, turning in impulsive fashion down from 831 high of a former higher degree wave C. We labelled a five-wave move in progress for a higher degree wave 1 or A; sub-wave iv correction can now be underway, with possible resistance at the Fib. ratio of 0.382 or 0.50. Also the upper side of the lower parallel corrective channel line can react as resistance, and the former swing high of a wave b (796'2 lvl.). A sharp break below the 782 lvl. would suggest a completed minor correction and sub-wave v underway.
An impulsive fall, followed by a break bellow the lower corrective parallel channel line indicates a bearsih turn on the intra-day chart of wheat.
