ZW1! ↗↗ With my humble experience, it seems to me that ZW1! will rise in the next few minutes.
Anyone who's interested in my analysis needs a consultant, I'm on duty.
XW1! trade ideas


BUY and BUY MORE After It cross the blue line !It will rise in the coming days
Technical indicators indicate that the big buyers decided to enter


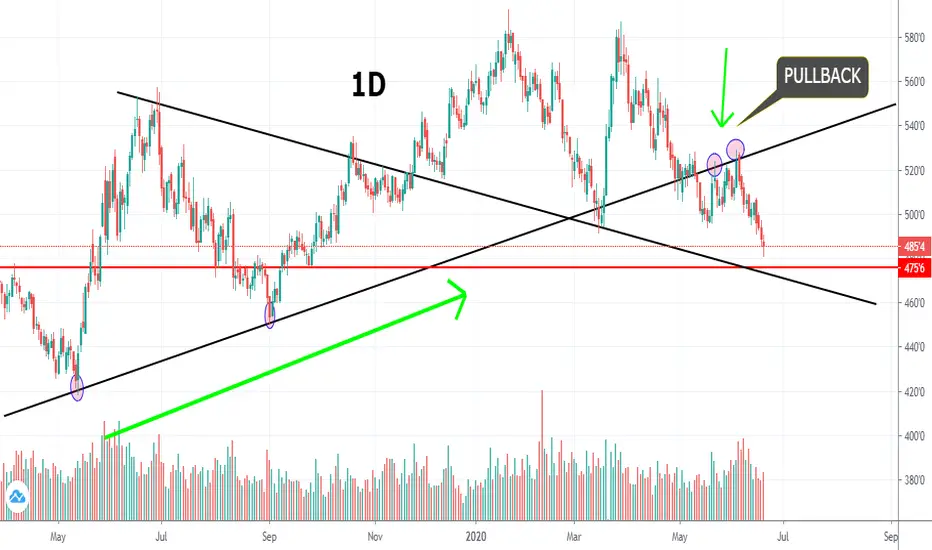
Potential rally in wheatBased on COT reports commercials are long wheat. They are correct 98%. It may take time to form a buy signal. But with that in mind, we look for buy signals - whatever happens first
- break out of daily resistance
- lower high + oversold oscillator
- divergence (I use RSI and OBV)

ZW1! To shortIt is possible to be more downside when market opens and test a level of 472,20 and 437,20 dollars
Please support this idea with like ,if you find it useful ,


ANALYSE DU BLÉ ! VENTE MOYEN-COURT TERME la semaine dernière sur l'amélioration des perspectives du commerce américain avec la Chine, bien que bénigne aux États-Unis. les prévisions météorologiques ont poussés les vendeurs sur le marché du blé à vendre une partie de leurs stocks. .
le département américain publiera mardi le 30 ses derniers rapports sur les stocks des céréales américains trimestriels . Les analystes s'attendent a une augmentation de l'offre ce qui pourrait emmener à la baisse le cours du prix du blé et des autres céréales à la baisse à court terme.
Analyse technique :
Mois(graphique en bas): la tendance de fond représentée par l'oblique représentant l’histoire du cours du blé depuis 1971 est haussière . les prix pour le moment son bloqués par un niveau pivot à 499.6 $ le boisseau.
Au niveau ichimoku. les prix sont dans le nuage donc montrant un signal neutre pour le moment; mais les autres éléments de ichimoku montrent aisément qu'on entre dans une phase de stabilisation donc début d'un potentiel range.
Avec comme indicateur la matérialisation d'un squeeze et le niveau plat de kijun et de la tenkan.
Semaine(en haut à gauche): la tendance de court terme est bel et bien baissière . les prix sont en dessous su nuage , la tenkan en dessous de la kijun et la chicou qui ne semble pas avoir d'obstacle a part des niveau support de court et moyen terme . le squeeze qui montre son nez semble nous indiquer que la tendance n'a pas fini de donner son dernier mot. j'ai donc ciblé comme objectif 436.4 $ et comme deuxième objectif 439.4$ qui représente un niveau clé historique .
Jour(en haut à droite): Après avoir clôturer en baisse avec prêt de 2.5% le vendredi, les acheteurs semblent avoir repris la main pour un certains temps . nous attendrons donc le signal vendeur avec les bougies HA pour renforcer noter position vendeuse sur cette matière première.


CUP & HANDLEDISCLAIMER :
The content on my TRADINGVIEW profile is for informational and educational purposes only and is not and should not be construed as professional financial, investment, tax, or legal advice. Trading has large potential rewards but also large potential risk. Do not trade with money that you cannot afford to lose. The past performance of any trading idea is not indicative of future results.


ZW1! Technical analysisPrice has reached a target zone, so there may be a short term corrective move up to some sweet spots where the daily short trend may resume. Targets are indicated in magenta, short trend is valid until price closes above the green zone on the daily.