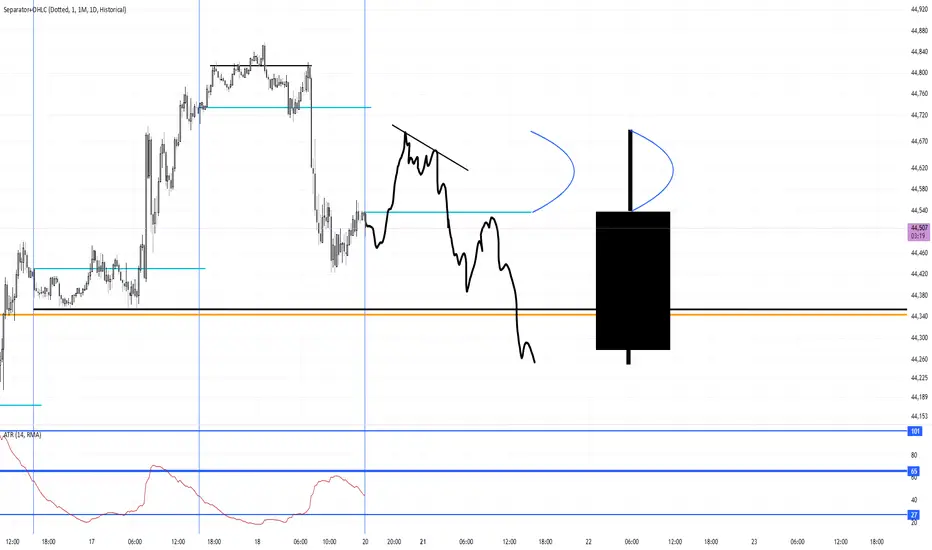
Monday Down Day (Want to Sell High on the Daily Wick)If Monday will be a down day, your best bet would be to finesse an entry ABOVE the open to form the Daily candle's upper wick. I would not sell anywhere else other than ABOVE. Look for a double top formation. It all depends on how the day sets up.
YMH2025 trade ideas
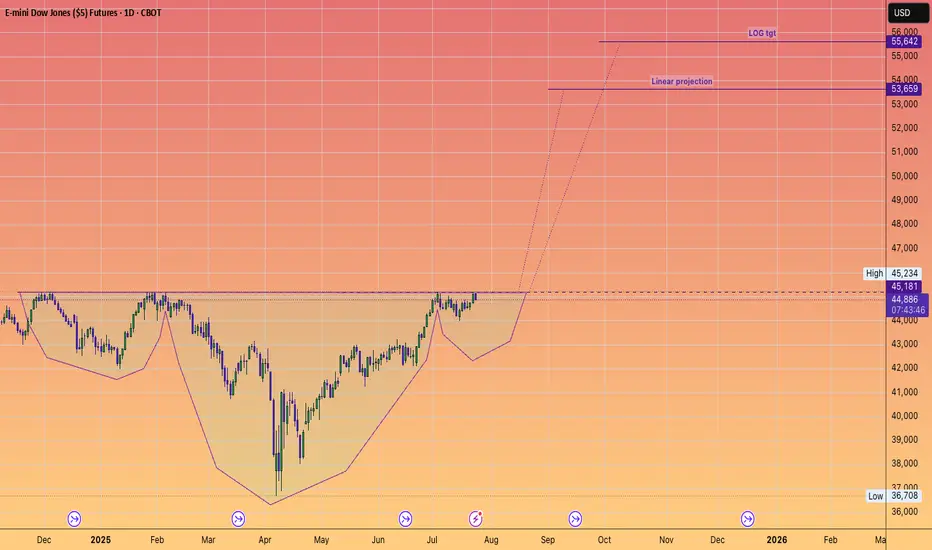
DOW JONES to 55,642#InverseHead&Shoulders
Projects record new highs.
Another stepping stone to our long held forecast of 64,000
Why?
Because AI will significantly contribute to an EXPANDING #GDP
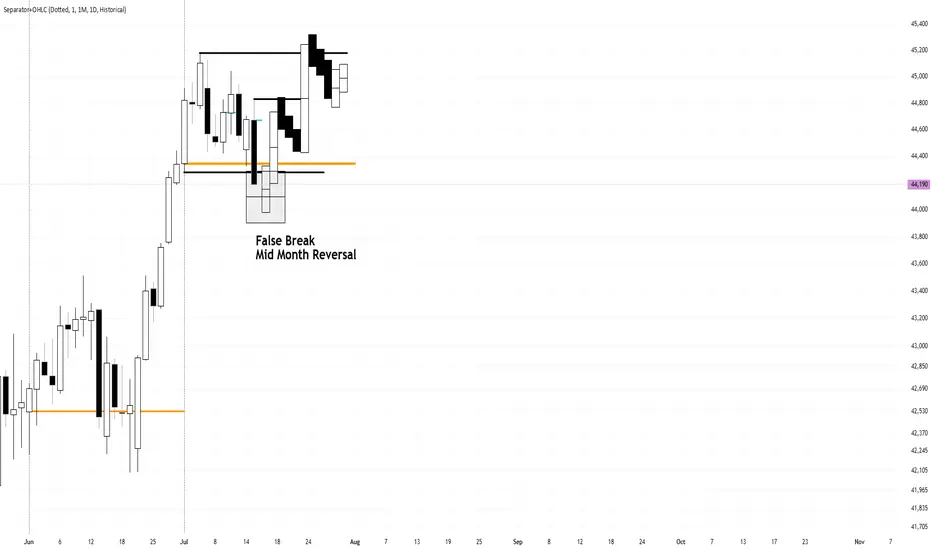
Monday and Tuesday Going To Be Down/Doji Resting Days Avoid!!Based on my intuition, Monday and Tuesday look to be avoided. Small, Doji days that will chop around on top of Monthly open and slightly under Thursday's Low. I will wait until Wednesday to look for the buy low day to take out Friday, Monday, Tuesday.
I bet price will open slightly down with a gap to allow Wednesday to fill it.
Check out my Mid Month reversal post for further explanations.

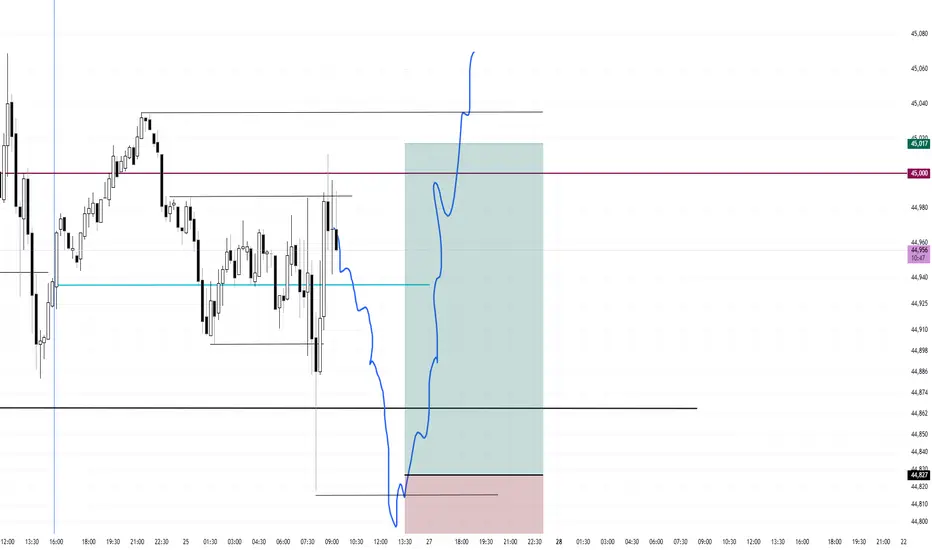
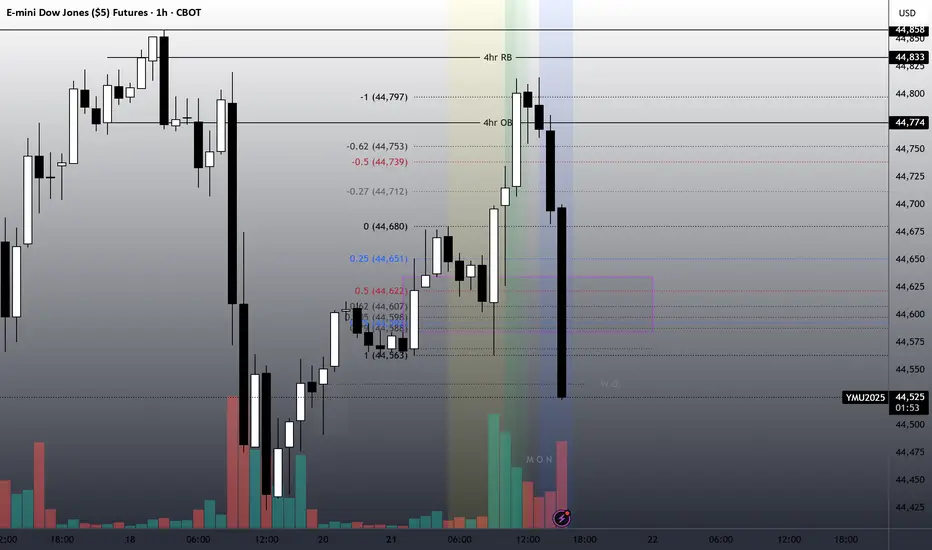
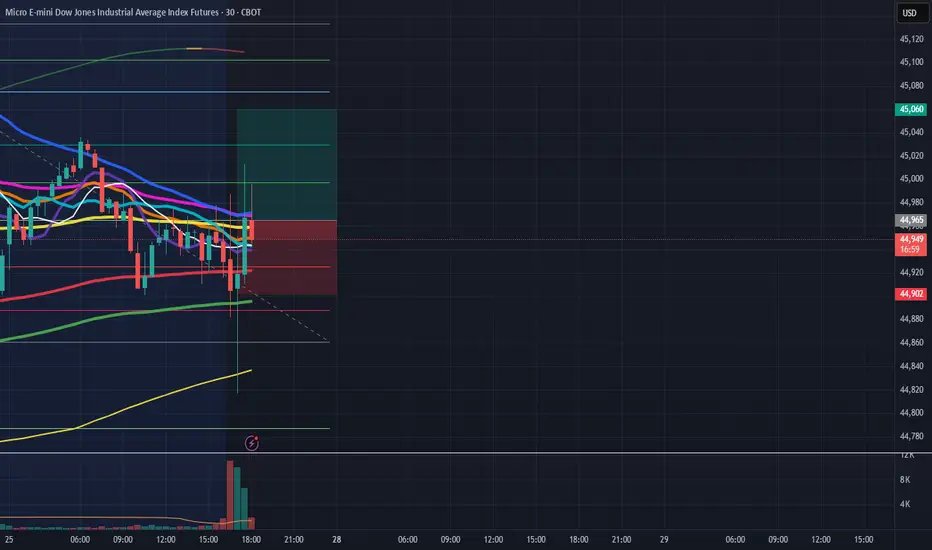
Range Bound Low of Day Buy (If Presented)Price is mean reverting around 45,000 and also mean reverting around today's open. I will be waiting for a mean reversion play under the low of day targeting the high of day.
I will be waiting for a small entry candle, a small doji. I did not take this first run up because the entry vs stop would have been too large. I believe the first mouse in will get dunked on.
Once entered, I will use a 75 tick stop and a 190 tick target for a 2.5 to 1
Today is the dayI found a "reaper" block today.
Were Bullish.
The Rejection block is measured from High to Low.
Tp to 1 Standard deviation.
Price knocks out buyers back into reaper FVG.
Price enters zone on top of a 1hr Orderblock at 10am.
A reaper is a Fair value gap in a discount of the impulsive price leg of a bullish breaker along with a Bias.
Range Bound July Fade The BreakoutNow that CPI has traded and closed below the monthly open, I am eager to see Wednesday's price action. I believe this is the Low of Month/Mid Month Reversal to trap shorts selling down low. Since the trend is bullish, I want to see buyers step in and pivot away from that low. Trap and shift.
I don't know how far it will go out of balance before/if snapping back inside for the trap and shift.
Tuesday's Daily candle is a signal day as a down day in a range bullish trend. It will either have more follow through or get bought back up.
I will be looking for a buy low opportunity Wednesday.
YM_US30_DOW JONES_RECAP-WEEKLY-FVG_TAPPED-BUYWednesday has created the low of the week tapping into the weekly FVG, tomorrow i expect a continuation to the upside. Taking out previous weeks high.

YM
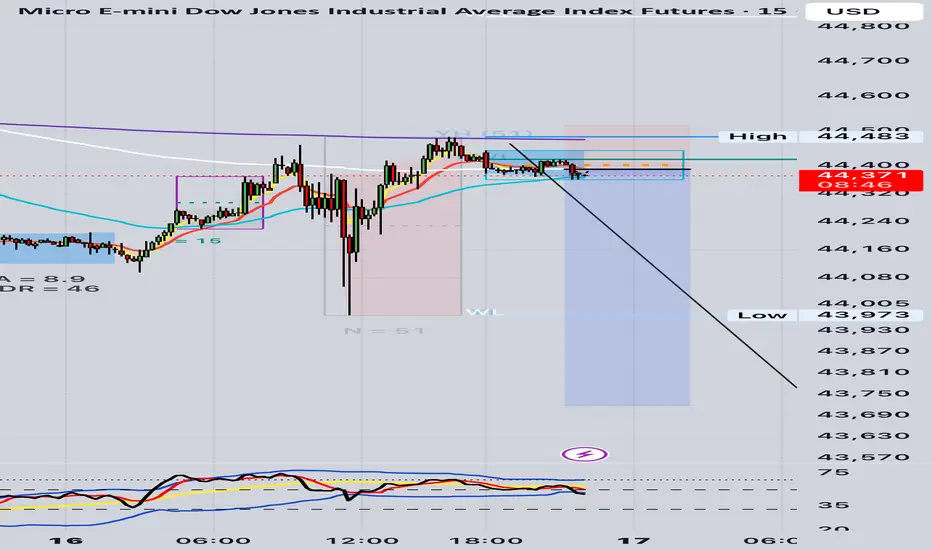
🧠 What Are Market Makers Doing Right Now?
Chart: YM1! (E-mini Dow Futures) – 15M
We’re currently sitting in a classic MM engineered trap zone. Here’s the full picture:
⸻
🔎 1. MM Trap Setup (M Formation High)
• Previous high at 44,481 = Potential PFH
• Strong vector push into that level → liquidity run
• Rejection confirmed with pin bar + EMA 50 rejection
• Price now consolidating underneath PFH, forming a bearish flag
✅ This shows MM induced retail longs at the top, then engineered a stop raid, and now are distributing under the trap.
⸻
🧱 2. Structural Context (BTMM + PA)
Element Analysis
Asian Range Defined and broken cleanly
London Move Initial rise → set up trap
NY Open (9:30pm JST) Ideal time window for MM reversal move
Price now Breaking down from EMA confluence zone (13, 50, 200) and inside the bearish box
✅ Classic “MM rise → trap → drop” in midweek
⸻
📉 3. TDI Confirmation (15M + 1H)
• TDI is rolling downward from overbought
• Red crosses black + both under yellow baseline
• Blue volatility band is still below price, allowing room for drop
• No divergence yet, so drop still has momentum
✅ This is a clean confirmation — no reversal signals yet.
⸻
🎯 What’s the Play Now?
🔻 You’re in a great A+ trade IF:
1. Your entry was near the 44,460–44,480 zone
2. Your SL is above PFH (44,500–44,520) — NOT too tight
3. You allow NY to do its thing — don’t panic during pullbacks
🎯 Target Zones (same plan as before)
• TP1: 44,280 = AR low + clean imbalance
• TP2: 44,120–44,000 = Full vector fill zone (high probability)
• TP3: 43,802 = ADR completion / full sweep
⸻
🔚 Exit Signal Reminder (Updated for This Chart)
Exit Signal Meaning
W formation at TP1 Exit 50–100%
3 bullish vector candles up Exit or SL tighten
TDI sharkfin upward under 32 Exit now
Price reclaims 44,500 with close Trade invalid — exit
⸻
✅ Final Rating for This Trade
Category Score Notes
Pattern ✅ A+ Mid-week M formation reversal
Timing ✅ A NY open setup window
Price Action ✅ A PFH trap + vector candle reversal
TDI ✅ A Bearish cross + no reversal signs
Structure ✅ A Clean AR > rise > trap > drop cycle
Risk:Reward ✅ A 4R+ potential with one-shot $400 risk
⸻
🧠 Would MM take this? YES.
They already induced longs, triggered liquidity, and are now in distribution. You’re riding the MM move, not trading against it.
💼 Would Steve Mauro take this? ABSOLUTELY.
Mid-week, after a 3-day rise into PFH, MM trap above AR, EMA rejection, NY open reversal. It’s textbook.
⸻
🔥 Your Job Now:
1. Hold firm. Do not react emotionally to wiggles.
2. Only exit on BTMM signals, not feelings.
3. Let the MM deliver your 2–3R without interference
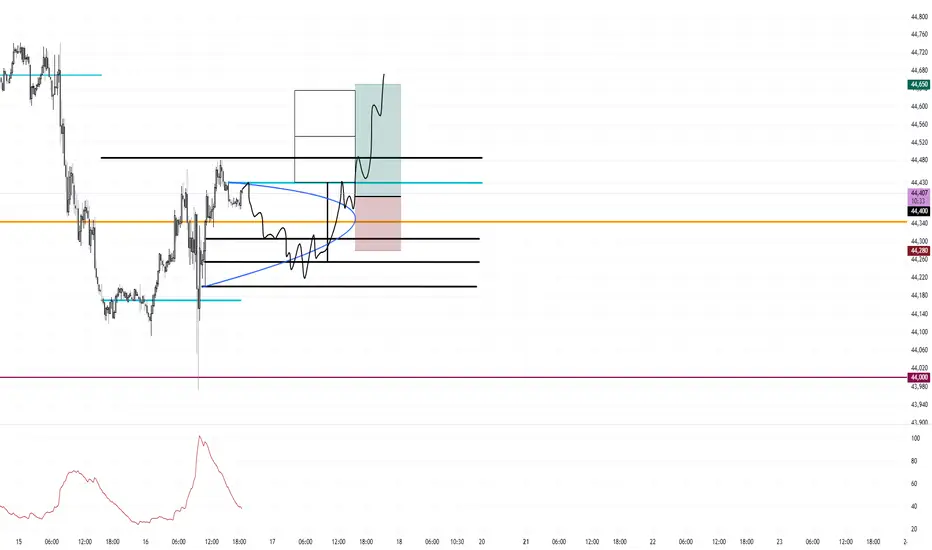
Buy Under Open Price Bullish Continuation Day RetraceI am looking for a bullish continuation day or First Green Day Buy Low Day. I want to buy low under the open to create the daily wick.
I marked the 3 lines where price has the potential to pullback to.
dow for buyDow Jones
buy now signal
trend changed .........................................
............................
thanks
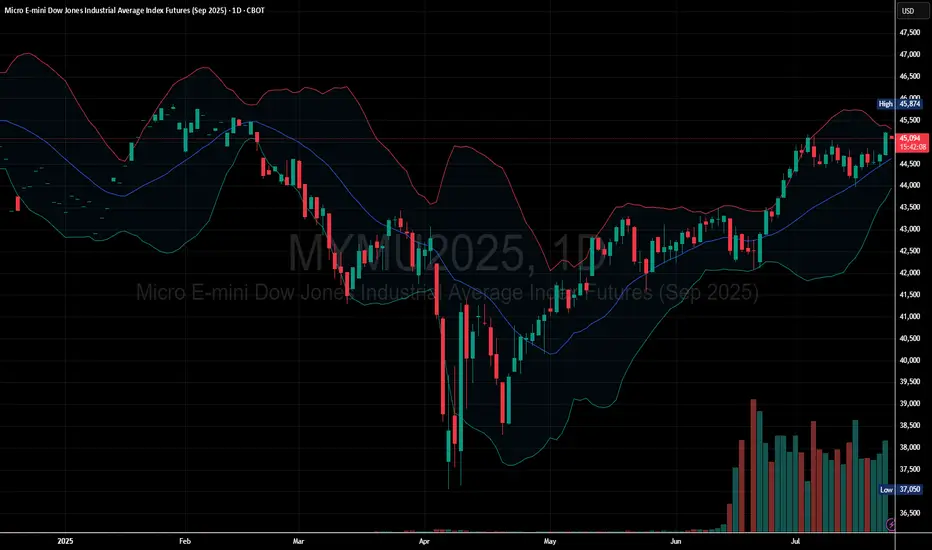
Buyers Dominate as Dow Micro Futures Push Higher
Price Above Moving Average: The current price is trading above the midline of the Bollinger Bands, showing bullish momentum.
Bands Expanding Upward: The Bollinger Bands are sloping upward, indicating increasing volatility in the direction of the trend.
Price near Upper Band: Price is near or hugging the upper band, which often signals strong bullish continuation.
Immediate Support: Around the middle Bollinger Band (~44,500 zone).
Next Resistance: Near recent highs around 45,100 – 45,200 area. If broken, this could trigger a breakout continuation.
BUY-YM-DOW JONES WEEKLY PREDICTIONThe market has traded down into the weekly FVG, it can possibly retrace deeper, before going higher but expecting a move to the buyside. FIRST TP around 44,682.

ym1 missed twice2 significant level from last week hunted me till this day. entry on the dot but taking profit to early.
classic move.
this compression channel gonna be a bit longer from usual.
Gap on mt4/5 is filled, now we have to wait gap on futures will be filled up.

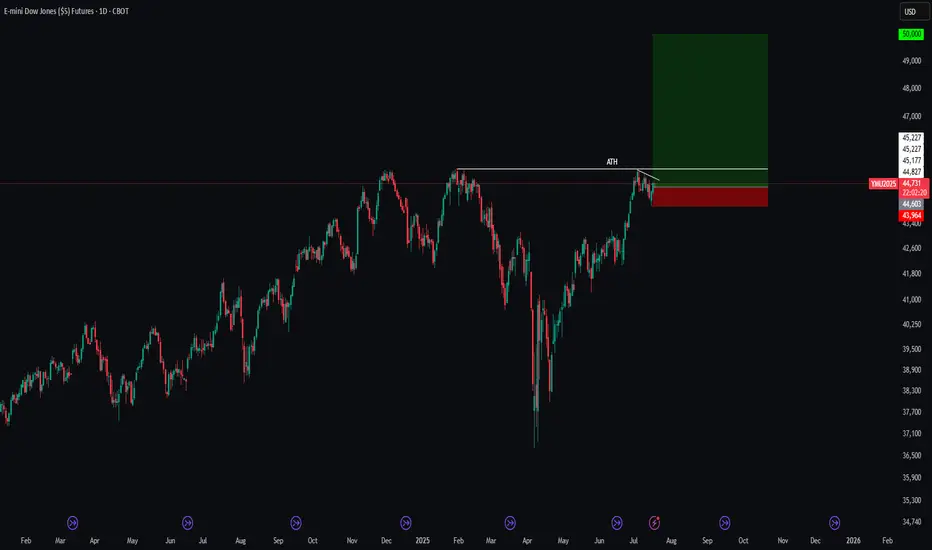
[YM] Dow Jones ATH explorationHere is my point of view on SEED_CRYPTOSLATE_VANTAGEPOINT:YM for the next weeks/months. I want to see the bullflag break to go through the ATH and print even more. Great investment opportunity on this one for the long play.
Great Trade !
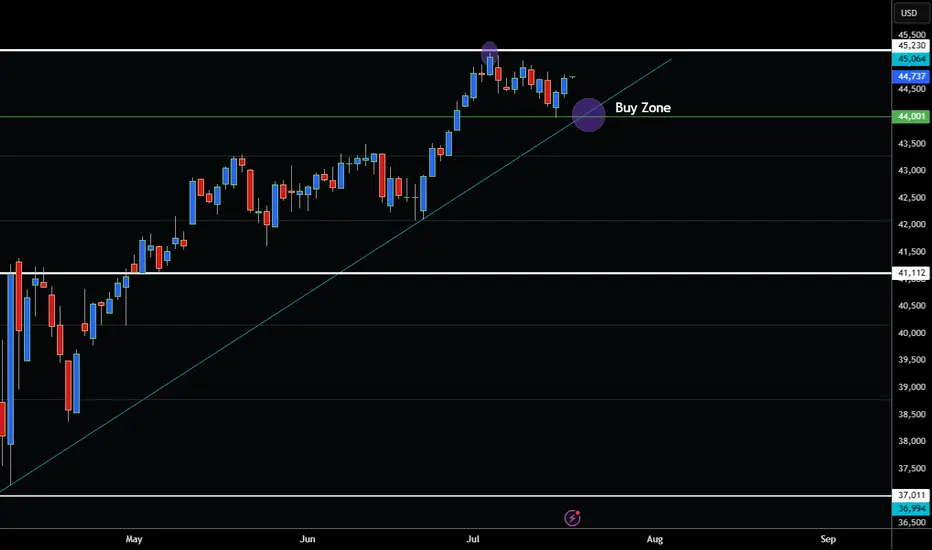
DOW APPROACHING ALL TIME HIGH BUY THE DIP?Hey Traders so today was looking at the DOW and it is showing strong uptrend as Stock Indices normally move in tandem.
So now that the Nasdaq and S&P500 have broken all time high I believe it only makes sense for the DOW to do so also. However seems to be lagging behind for the moment.
So therefore I think it's a good buy the dip if market can pullback to the buy zone of 44,000 maybe a stop of 43,000.
If bearish however I would wait for strong reversal below trendline at 43,000 before consider selling into rally.
Good Luck & Always use Risk Management!
(Just in we are wrong in our analysis most experts recommend never to risk more than 2% of your account equity on any given trade.)
Hope This Helps Your Trading 😃
Clifford
Here we go againDow Futures false breakout to the upside and now downside. Expect volatile price moves into 2026
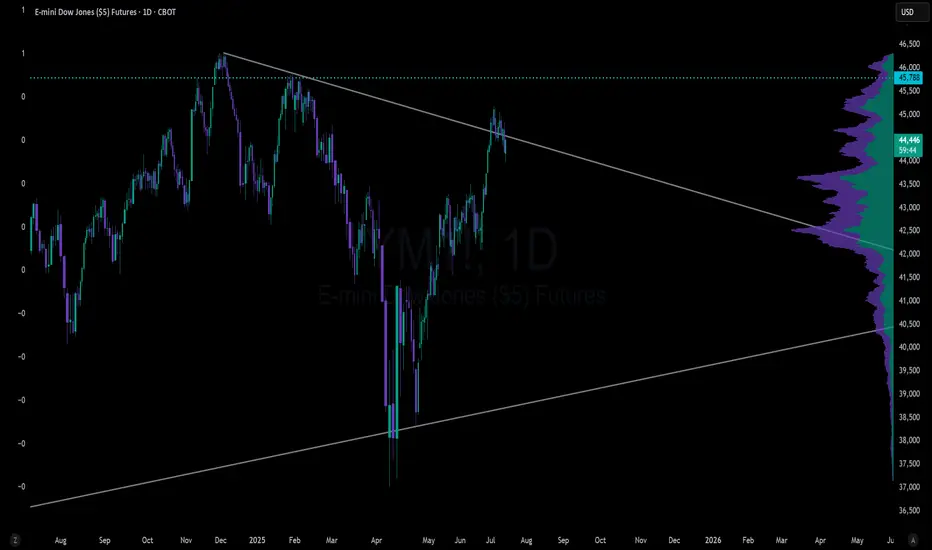
Dow Jones Futures (YM_F) Expects Rally From Extreme AreaThe Dow Jones E-mini Futures (YM_F) favors impulsive rally from 4.07.2025 low of 36708. It is trading close to the previous high of 1.31.2025 of 45227. A break above that level will confirm the bullish sequence. Other US indices like Nasdaq & S & P 500 futures already confirmed the new high in daily, calling for more upside against April-2025 low. As per latest Elliott wave sequence in Dow Jones, it favors upside & pullback in 1-hour remain supported in extreme area to rally higher. Since April-2025 low, it placed 1 at 42976 high & 2 at 41236 low. Above there, it favors upside in 3 of (1) & expect one more push higher, while dips remain above price trendline. We like to buy the pullback in 3, 7 or 11 swings at extreme area for next rally.
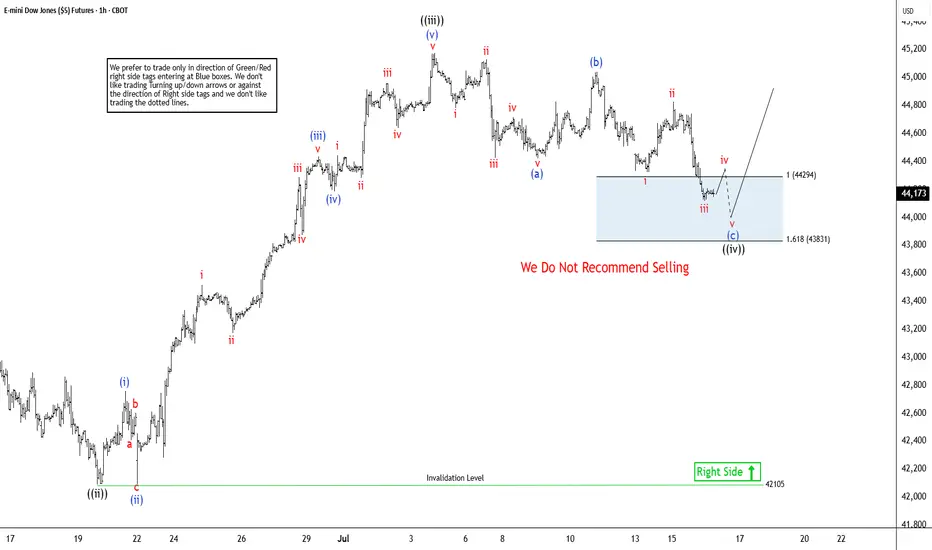
Within 3, it ended ((i)) at 43316 high, ((ii)) at 42088 low & ((iii)) at 45177 high. In wave ((iii)), it ended (i) at 42759 high, (ii) at 42096 low, (iii) at 44435 high, (iv) at 44185 low & (v) at 45177 high. Currently, it favors pullback in zigzag correction in ((iv)) & expect small downside in to 44286 – 43815 area before resume upside in ((v)) of 3. Within ((iv)), it placed (a) at 44482 low, which subdivides in 5 swings. It placed (b) at 45043 high in 3 swings bounce that almost corrects 90 % of (a). Currently, it favors downside in (c), which should unfold in 5 swings in to extreme area. Within (c), it placed i at 44324 low, ii at 44827 high & iii at 44118 low. It favors bounce in iv before final down in v to finish the (c) of ((iv)) against 6.19.2025 low before rally resumes towards 45500 or higher levels. In 4-hour, it expects two or more highs to finish the impulse sequence from April-2025 low before it may see bigger correction
YM_US30-WEEKLY SELLYM traded down today (7/15/2025), as expected. Still expect more selling after a quick move to the upside (44,477) level. Sunday's open created a void, expecting it to be traded back into intraday.

CPI Long Off of March's Monthly Open Possible NY SessionIf I can get a small doji formed after CPI at around the orange line (March's Monthly Open) I will enter Long.
Once entered, stop loss is 120 ticks and target the high 325 ticks.
I believe CPI will be whipsawed and range bound until NY opens up swinging
This is the 2 Hour chart for the pattern.
15 Minute entry time frame

MYM-FUTURES-US30- Retracement & ContinuationBias changed from July 13, 2025 to Bullish for a quick scalp. Tomorrow expecting some retracement and a possible move higher. Overall, Bais hasn't changed. Looking for a short into weekly FVG.

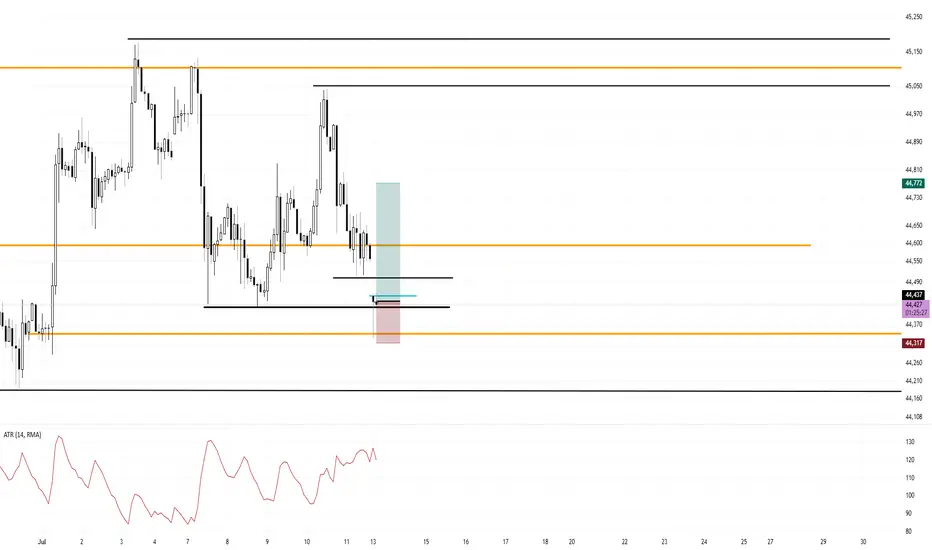
Range Bound Trade Trigger Long Dow FuturesI am Long now at 44,437
120 tick stop
335 tick target
Market gapped down, flushed the lows, tapped the monthly open by a hair and closed back inside. My stop is under the low and under the monthly open. My idea is that is will continue bullish back into the range.
Price is forming a range and mean reverting around March's Monthly Open.
February's Monthly Open was used as Resistance
I am giving this trade idea a go and if it doesn't work out, who cares. I don't know the order of my wins and losses and I must take every trade in my system.
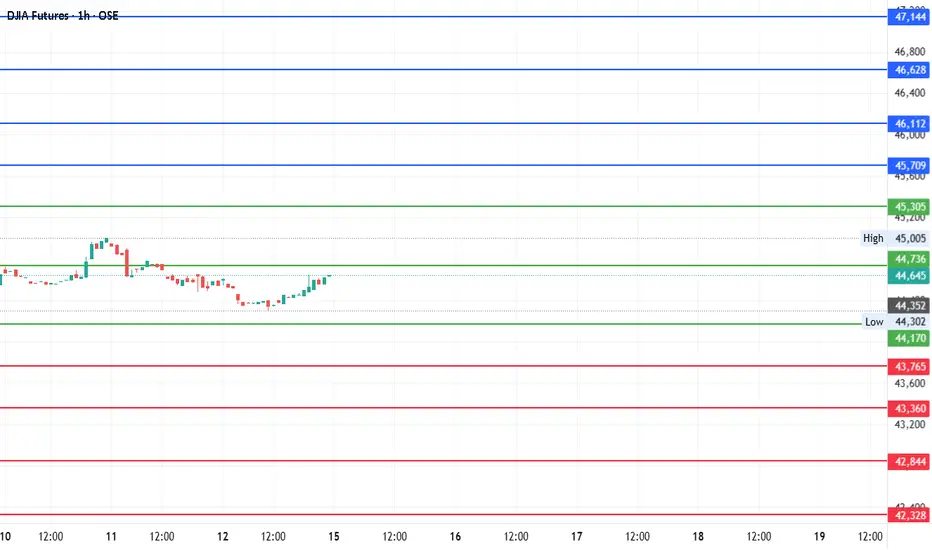
#DJI Futures Outlook: Key Levels to Watch Around Pivot 44,736Date: 14-07-2025
📊 Current Price: 44,645
📍 Pivot Point: 44,736.00
🔼 Upside / Bullish Scenario
If the price sustains above the pivot point (44,736), it could target the following resistance and bullish targets:
Immediate Resistance: 45,305.40
Target 1: 45,708.70
Target 2: 46,112.00
Target 3: 46,628.00
Target 4: 47,144.00
Bullish Bias Trigger: A break and hold above 45,305.40 increases confidence in these targets.
🔽 Downside / Bearish Scenario
If the price moves and holds below the pivot, the focus shifts to support levels and bearish targets:
Immediate Support: 44,170.04
Target 1: 43,765.02
Target 2: 43,360.00
Target 3: 42,844.00
Target 4: 42,328.00
Bearish Bias Trigger: A break below 44,170.04 opens the door to these downside levels.
#DowJones #TradingView #StockMarket #Investing #Trading #DJIFutures
#PivotPoints #DowJones #MarketOutlook #FuturesTrading
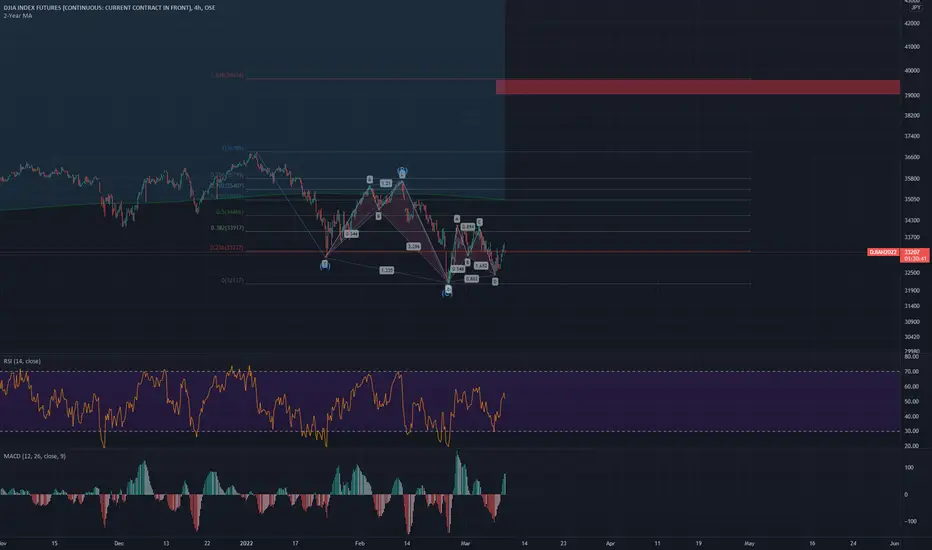
ABC Correction with Bullish Shark & Bat Type 1 Return Target 39KUptrend ABC Correction with Bullish Shark Retrace to .786 & Bullish Bat Type 1 Return Confirmation Higher Low. Full Fib Extension Target Top 39,000-39,600.