YM - Dow Jones Coming Like Bitcoin??!Unlike ES and NQ, last week booked all-time highs but failed to close above the monthly buyside liquidity @ 40,702.
This weeks candle opened with a gap relative to the close of the previous weeks candle, spiked to the downside before closing above the previous monthly buystops.
Friday was the day we saw the most movement.
YM1! trade ideas

YM - You Know I Like My Low Hanging Fruits.Got my sights dialled into $40,442 as YM, in comparison with ES and NQ is late to the game.
What game you might ask?
The game of savaging sellers!

OHLC Statistical Mapping-manipulation got my attention when I am bullish and I targeted -Distribution. Simple bread & butter model on YM which presents nearly every day.

Sell Opportunity on E-mini Dow Jones (5$)Hello,
We've identified a huge current opportunity to Sell E-mini Dow Jones (5$) Futures with a high probability in the Daily chart.
The target is set at 40000$ first and 39800$ Second within a few days (Swing trade).
Ibrouri

YM Day Trade and Swing Trade (Setup Range Sell Continuation)For my Monday gameplan:
Downtrend continuation from the Range High to the Range Bottom
Pullback Somewhere in the 50% level
Take out the low from Friday and the 5 bottom liquidity from last Monday- Tuesday
Hit the mid point of the bottom of the range and close the gap from last Monday
Daytrade:
50 tick stop
200 tick target
4:1
Not looking for anything massive, just 150-200 ticks. My daytrades are base hits
Swing Trade:
On my other swing trading account, I will take the same trade idea and hold it for a couple days, using a bigger stop and bigger target
150 tick stop
800 tick target
8.33:1
Target possibly hit if trade works, Tuesday

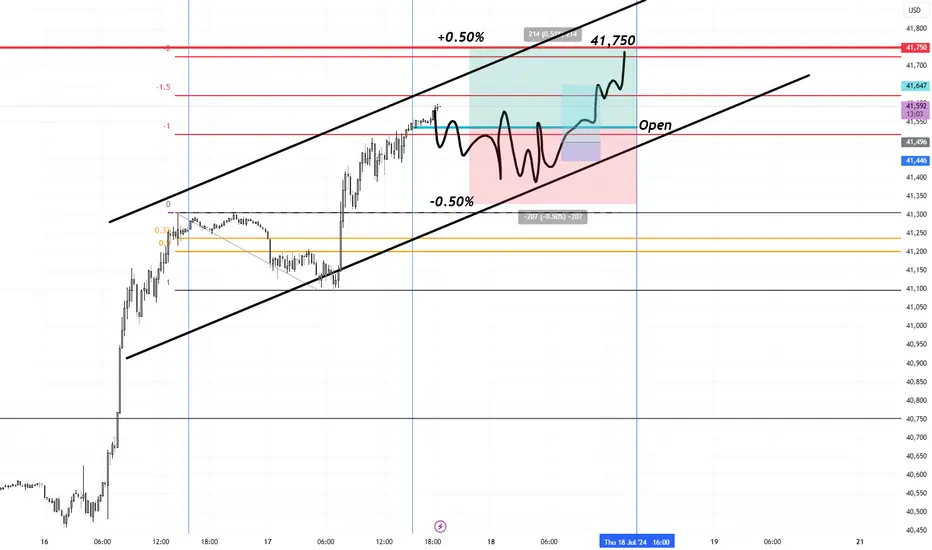
Dow Jones Futures Daytrading Setup Continuation Long 41,750I am looking for a pullback Long for the continuation up to 41,750 which is around the 2X range expansion. A somewhat of a repeat of yesterday. A dip below the open followed by Long at the NY open.
I will have to see how price is behaving towards the NY open.
My stops are always 50 ticks and my targets are 150 ticks. 3 to 1
Using my wealth trade, price is now in breakout mode on the weekly and will be ripping higher to 49,000. I will only be looking for Longs for the next 12 months.
Dow Jones Transitioning Into Range August CPI BreakoutDow Jones has now transitioned into a range. I will be changing my plays to range bound plays.
My thesis is it will spend 4 weeks going sideways before the August CPI report will breakout Long up to 42,000 and then up to 49,000.
I will look for sells in the red upper box and buys in green lower box.
I will use the quarter dotted lines as price targets and possible bounces off of.
I will be looking for runs of highs and lows for liquidity sweeps.
Each 25% level of this range is roughly 350 ticks.
The entire high to low of this range is roughly 1400 ticks
Here is a rough idea of how I plan to daytrade this range.
Looking to target swing highs and lows for sweeps
Looking to target each 25% level for profit targets
Entry Model: 15 minute chart
4 Hour Structure
Weekly Trend
50 tick Stops
150 tick Targets
3:1 risk to reward
40-45% win rate
Only 2 losses per trading day

YM - Draw On Liquidity @ $40,673?Bullish elongated uptrend for sometime now and the next draw on liquidity before possible major shift is @ 40,673.
When will we see it book?

Dow Jones Wealth Building Trades 1987 2.0 Long 49,000I have fine tuned my add strategy on this trade that I have been in for almost a month now. I am trading off of the weekly chart.
My original entry was June 30th at 39,520
I added again July 16th at 41,268
I plan on adding three more times, using the profits from the other two positions to fund these new positions.
Add 2: 42,500 area
Add 3: 44,000 area
Add 4: 45,200 area
I will bail out and close all positions by 48,500-49,000 area
What I don't get is why the market is setting up another 1987 style flash crash around August 2025?
Nearly EVERYTHING is identical to 1987 setup that this is what I am basing my trade off of.
Compare the two charts below and let me know. One from today and one from 1987
1987
2025
I am not sure what to do about that massive shorting opportunity coming up, if I want to just YOLO 10% of my portfolio on it. I feel ok with taking a 10% hit if it doesn't pan out. Or, do I just sit on cash and wait and see. I will have to wait until price starts to unfold later.

YM OHLC Statistical Mapping + Average Range Levels by Toodegrees1/3ADR- & +Manipulation = gem | Target was 1/3ADR+
RINSE & REPEAT 1/3RR BOOKED.
Checkout my profile for the biggest discount + plenty of examples of these tools which plays out every single day and week

Dow Jones Futures I am liking what I am seeing with the Dow. Hopefully we can get another push tomorrow. If we need our current markups will be as the picture follows. Now can we see some massive moves this week. We can with the current news that is coming out this week.

Wealth Building Trade Update (Long until 49,000) 25% Spike Down Just providing an update on the status of the market. Now that 40,000 is broken out of, it is on the march towards 50,000 or the 1.25X range expansion. After which the market will make a 25% spike down into the 0.50 level of 37,000 before continuing on the grind to 150,000.
This is all my own personal speculation of course but this is how I am trading the market. That spike down lines up perfectly with the 0.50 level AND that long term bull trendline. It also makes a higher low above November's 33,000 low.
This will allow the 49,500 high to be fuel as a weak high to be broken. Once 50,000 is broken, then the market will start to grind higher up to 150,000 and eventually accelerating towards the end.
The covid spike down was 36%. The June 2025 spike down will only be 25%, enough to shake off higher level longs before the march higher. I will out before that level.

YM Textbook setupOHLC Statistical Mapping was precise as hell today! Textbook setup -> I was bullish so +Manipulation to +Distribution and nearly 1:5RR booked!

Elliott Wave Suggests Right Side in Dow Futures (YM) Firmly BullDow Futures (YM) shows incomplete Elliott Wave bullish sequence from 4.19.2024 low favoring further upside. Rally from 4.19.2024 low is unfolding as a 5 waves impulse. Up from there, wave 1 ended at 40213 and pullback in wave 2 ended at 38111. Wave 3 higher is now in progress with internal subdivision as another impulse. Up from wave 2, wave (i) ended at 39174 and pullback in wave (ii) ended at 38436. Wave (iii) higher ended at 39999 and pullback in wave (iv) ended at 39488. Last leg wave (v) ended at 40006 where it also completed wave ((i)) in higher degree.
Pullback in wave ((ii)) unfolded as a zigzag structure. Down from wave ((i)), wave (a) ended at 39595 and wave (b) ended at 39730. Wave (c) lower ended at 39448 which completed wave ((ii)) in higher degree. The Index has extended higher in wave ((iii)). Up from wave ((ii)), wave i ended at 40200 and dips in wave ii ended at 40014. Wave iii higher ended at 40572 and pullback in wave iv ended at 40279. Near term, expect wave v of (i) to complete soon, then it should pullback in wave (ii) to correct cycle from 7.9.2024 low in 3, 7, or 11 swing before it resumes higher. Near term, as far as pivot at 39448 low stays intact, expect pullback to find support in 3, 7, 11 swing for more upside.

Strategic Insights: Trading the Dow Jones US30 Amidst Historica**Volatility**
With the Dow Jones US30 index currently sitting at all-time highs, traders are closely monitoring potential movements and preparing strategies to navigate the market's next steps. The trend remains bullish, but the formation of a new demand area around the 40,150 mark introduces intriguing possibilities for both long and short positions.
***Key Observations:***
**Current Trend:**
The Dow Jones US30 has been on an upward trajectory, reaching historical peaks.
This persistent bullish trend reflects market optimism and strong economic indicators.
**Critical Demand Area:**
A significant demand zone has emerged around the 39,950 level.
This area could serve as a crucial support level, offering potential buying opportunities if the price remains above it.
**Trading Strategy:**
**Long Positions:** Consider entering long trades above the 39,950 demand area to capitalize on continued upward momentum. This strategy aligns with the prevailing trend and leverages the support from the demand zone.
**Short Positions:** Conversely, if the price falls below the 39,950 level, it could signal a potential bearish reversal. Entering short positions below this threshold may allow traders to benefit from a possible correction or downtrend.
**Liquidity Considerations:**
As the price reaches new highs, liquidity dynamics become crucial. The market might experience significant volatility as traders take profits or as new participants enter the fray.
A sharp reaction at these levels could trigger a substantial price drop, amplifying the importance of monitoring liquidity flows.
**Upcoming Event - Jerome Powell's Speech:**
Federal Reserve Chairman Jerome Powell is scheduled to speak on July 15, 2024, at 12 PM noon.
Powell’s remarks could provide critical insights into the Fed's economic outlook and monetary policy stance, influencing market sentiment and potentially triggering significant price movements.
*Conclusion:**
In summary, the Dow Jones US30 presents a promising yet cautious landscape for traders. The all-time highs and newly formed demand area around 39,950 offer a balanced approach for both long and short trades. The market's reaction to upcoming events, particularly Powell's speech, will be pivotal in shaping future trends. Traders should remain vigilant, adapt to emerging developments, and employ disciplined risk management strategies to navigate the evolving market conditions.

YM - Still ChoppyMassive diversion between YM and ES, NQ.
Sell stops has been taken gibing YM a good leg to stand on if we were to shoot to 39,800 and possibly target the 39,999 buyside liquidity

Dow Jones Futures Daily Pullback Buy SetUp Wealth Building TradeI will be placing a buy order as soon as Sunday Opens for a pullback on the daily chart. I will be placing my stop loss UNDER 2024's open price marked as the fat Cyan line as I don't believe price will return down there.
I will be going for the throat on this trade and will be adding all the way up to 48,500 as my target.
I will be disregarding my prior posts as I now see this is the actual price action. Very strong and getting ready to breakout to new all time highs again.
I will try to explain what it is I am seeing as best as I can.
Price has been staying up above the top third AND has been bouncing off 2024's open price with higher highs. Any time price stays above the top third, this indicates extreme strength and continuation of higher prices.
I will be risking 400-500 ticks below 2024's open price depending on how I get filled Sunday afternoon and will be targeting 49,000 area for 9,500 ticks. I will add on the way up to get as much out of this as I can so that I can buy more when it gets back down to 38,000 again for the next move up to 150,000

Q3 Dow Jones Industrial Potential ShortWe May Be Seeing An Overbought Dow From Q1 And Q2 '23 Price Action. Pull-backs Are Imminent...

Dow Jones Futures CPI Long Trade 5 to 1 PotentialI am long right now with my fill at 40,012. Now that we have broken out, CPI will continue the momentum and I am targeting the next area of liquidity at 40,280. I am using a 50 tick stop and my target is 40,279 for a 5.34 to 1.
I plan on holding through the news because I don't believe price will return any lower and if it does, then I am out and I will regroup.

Bullish breakout on the menu for Dow futures?Traders should be on alert for a bullish breakout in Dow E-mini futures.
Sitting in a triangle and having found plenty of support on dips towards and below 39400 over recent weeks, the price closed marginally above downtrend resistance on Wednesday, managing to do what it was unable to on the prior three ventures above the level. With RSI and MACD providing bullish signals on momentum, the ducks are lining up for upside.
Should Wednesday’s high of 40067 be taken out, consider buying the break with a stop loss order below the former uptrend for protection. Resistance may be found around 40200 but it’s likely the record high 40358 will be targeted by bulls should we see a breakout. Beyond, a trip into the low 40000s could be on the cards given how long the price has been coiling in the triangle.
Thursday’s US inflation report presents a major risk event that could deliver a bull trap and/or reversal, underlining why a stop needs to be used to limit capital losses from an ugly number. A core reading of 0.25% more is unlikely to go down well for riskier asset classes. Alternatively, a figure below 0.2% will likely be cheered as it would strengthen the case for the Fed to begin cutting interest rates in September.
While the Dow is not a cyclical as it once was, improved prospects for steeper bond curves and a soft economic landing should benefit financials and other economic sensitive sectors.
DS

YM OHLC STAT MAP + ADR ShortDo I need to say anything? those tools are just insane... every day it offers a setup EVERY DAY, EVERY WEEK AND IT WON'T STOP.
+manipulation & 5ADR+ for shorts targeting 1/3-
just check out my bio and get yourself those powerfull tools which helps you to be profitable.

YM - Daily charting practicestarted on the weekly - grey levels
adapted them to the daily - red color
i left those so we can see price extend beyond the daily to reach the 4hr
4hr- orange levels. were then adapted to the 1hr levels
1hr - yellow level were adapted to a 15min level
15min - turquoise color.
its clutter but its a way to illustrate how price will test a higher timeframe level, and deep dive that level with a wick. fractal patters were created on lower timeframes within the body of the higher timeframe candle. the untested levels or unmitigated FVG or whatever you call them will be tested in this manner.
lets see.

Dow Jones Futures Daytrading Setup Monday July 8th LONGI will be looking for a pullback to the day's open price before the continuation Long. If price can stay above the cyan line and bounce off of it, that will be my entry. I am thinking around 30-45 minutes after the NY open
