YM1! US30USD DOW 2023 APR 17 WEEKCBOT_MINI:YM1!
YM1! US30USD DOW 2023 APR 17 WEEK
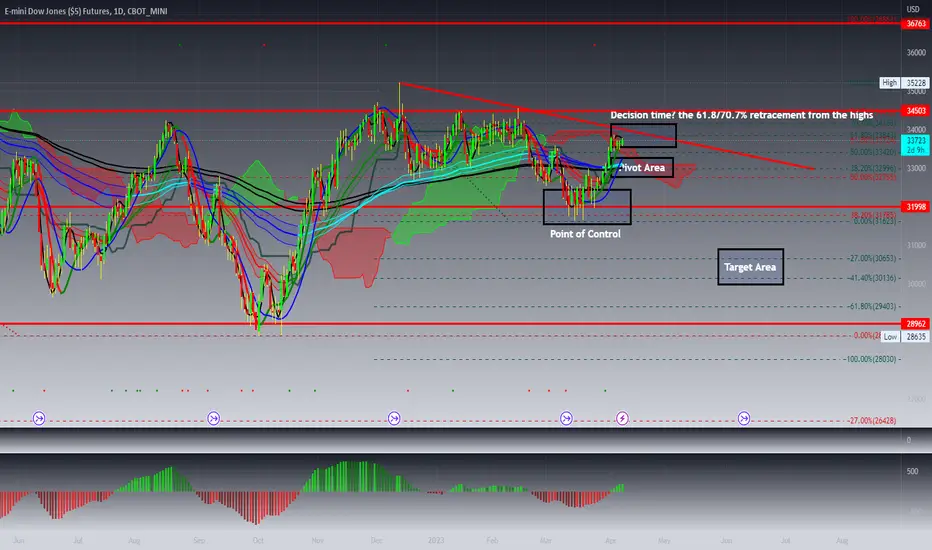
Previous long scenario2 at 32595 // 33590 worked well.
Potential weakness observed.
Market now is approx. 500pts away from 34605.
Possible scenarios:
1) Trade to be guided by channel
2) With weakness observed, wait to short at channel's
supply line or rejection at 35228 // or 34605 previous
rejection area
Volume Analysis:
Weekly: higher volume up bar close off high
= minor weakness
Daily: Higher vol mark up to close lower, and a close below
middle of bar = potential weakness
Price reaction levels
Short on Test and Reject | Long on Test and Accept
35228 34605 33590
32595 31657
Remember to like and follow if you find this useful.
Have a profitable week ahead.
YM1! trade ideas

The DJI thoughts for next potential move As we enter earnings season and all equity markets enjoying rallies from the lows
these are my thoughts on the DJI
Please always identify a set up at suggested areas for entries and always manage your risk
long position on YMMy strtegy is based on price action with the reading of certain indicators that I like whilerespecting all the values that define the stock maket

DowJones H1 As 33500 Supports Target A Pivotal 34000 Test NextIn this update we review the recent price action in the emini #DowJones futures contract and identify the next high probability trading opportunity and price objectives to target

YM1! US30USD DOW 2023 APR 03 WEEK
YM1! US30USD DOW 2023 APR 03 WEEK
Price was marked up on low volume =
possibility of trapping longs. Keep your stops tight
if you are holding long positions.
Possible scenarios:
1) Sell if False break of 33590, test and reject of
recent high
2) Long on test and accept of 32595 // 33590
Volume Analysis:
Weekly: Low vol up bar close off high =
possible selling, trapping longs
Daily: Wide spread low vol up bar close off high
= possible selling, trapping longs
Price reaction levels
Short on Test and Reject | Long on Test and Accept
35228 34605 33590
32595 31657
Remember to like and follow if you find this useful.
Have a profitable week ahead.

Sell setupTrade: Sell at 32975 or higher
Stop: 33150
Notes
The model:
The Ingenuity Trading Model is a Geometric Markov Model with specific inputs related to Price, Time, Volume , and Volatility. The model attempts to predict local minimums and maximums in price on a daily and weekly basis. A fancy way of saying a trading system that detects specific patterns in price, time, volume, and volatility and indicates whether to buy or sell.
On winning trades after 1 day take at least ⅓ of the position off and move stop to breakeven

DowJones H1 To Test Triangle ResistanceIN this update we review the recent price action in the emini #DowJones futures contract and identify the next high probability trading pattern and price objectives to target

YM1! US30USD DOW 2023 Mar 27
YM1! US30USD DOW 2023 Mar 27
Support long at 31747 was good.
Note the trendline resistance at the moment.
I'll be back in April, keep profits and rest from cold.
Possible scenarios:
1) Short on reject of 32789
Volume Analysis:
Weekly: Ave vol up bar close off high (some supply present)
Daily: Ave vol up bar close toward high
Price reaction levels
Short on Test and Reject | Long on Test and Accept
34689 32789
30513 28635
Remember to like and follow if you find this useful.
Have a profitable week ahead.

DowJones Set Up To For A Third Test Of Monthly Range SupportIn this update we review the recent price action in the emini DowJones futures contract and identify the next high probability trading opportunities and price objectives to target

Dow Jones (YM1!)- fuel up in this week and start droping in JulyDow Jones (YM1!)- fuel up in this week and the entry point is the box. After reaching to the above targets and if a reversal candle shows up. Be careful!

Dow Jones /YM : First Target Reached, What to Look for Next/YM hit the first target of 32650 shared in my previous idea (see below).
The next target is 32900, followed by 33200, 33500 depending on how price develops.
I have sketched two scenarios of equal probability.
1) Price finds resistance at the channel structure and pulls back before a push to 32900 T2
2) Price breaks channel resistance and makes a straight push to 32900
I will post updates as price develops.
Share your thoughts in the comments and leave a like if you found this analysis helpful
Previous /YM Analysis:

DowJones Actions Areas For The Weeke AheadIn this update we review the recent price action in the emini DowJones futures contraction and identify high probability action areas for the trading week ahead

DJIA: 19 MAR, 2023#DJIA #ShaneElliottWave #Shaneliot
DJIA || Elliott Main wave count || 19 Mar, 2023 (UTC-8)
---
Elliott Wave Analysis by: Shane Elliott Wave (Shaneliot)
Hello traders,
That's my wave count for: DJIA
Trading strategies: Short
Timeframe Analysis: 1D
Expect Main Elliott Mode: Motive wave
Expect Main Structure: Impulse
Position: Third Wave (Green- Minuette degree)
---

YM1! US30USD DOW 2023 Mar 20
YM1! US30USD DOW 2023 Mar 20
During the week, the formation of A-A1 rotation offered rotational
play opportunity.
Demand has built up, with weekly bar showing loss of selling
momentum. But it takes time for the vessel to turn, so wait for
support to manifest before going long
Possible scenarios:
1) Rotational play between 31750 - 32600 (approx 850pts range)
2) Continuation long = long on retracement, to test 33590
3) Short if 31747 was broken through and becomes resistance
Volume Analysis:
Weekly: Higher vol, narrower spread down bar close off low
= reduced downward momentum
Daily: Ave vol down bar close toward off (non-trend changing)
Price reaction levels
Short on Test and Reject | Long on Test and Accept
34689 32789 31747
31097 30513
Remember to like and follow if you find this useful.
Have a profitable week ahead.

Dow Jones Forecast: Waiting to edge lower amid mire of uncertain
Dow Jones dropped as risk-off took the driver’s seat ahead of FOMC meeting.
From a technical perspective, Dow Jones is brewing a Bat Pattern on the weekly chart.
In a shorter term, Dow is struggling to resume uptrend, what key levels to watch?
The recent bank sector woes triggered wild swings in the markets this week. The failure of three American banks and the crisis in Credit Suisse reignited the concerns over banking sectors even the broader financial system.
As the authorities quickly stepped in, the markets did calm for a while. The Dow Jones, S&P 500 and Nasdaq rallied on Thursday. Earlier this week, the Federal Reserve and Swiss National Bank announced to provide liquidities to relevant institutions to avoid an overwhelmed catastrophe, and a group of large U.S banks was reported to rescue troubled First Republic Bank by providing $30 billion lifeline.
However, the market has still been left in huge uncertainty so far as investors are trying to figure out if the latest developments would change the rate hike paths of central banks. With the Federal Reserve interest rate awaiting, many analysts are now expecting a 25 bps rate hike next week.
As a result, heading into the weekend, risk aversion regained control across the markets. At the time of writing, US equity indices retreated significantly from yesterday’s gains as Dow Jones led the way lower.
DOW JONES WEEKLY CHART
Technically, Dow Jones has decisively broken below the neckline of the Double Top Pattern on weekly chart, which usually hints further downside moves ahead. As shown above, the blue chip index may be establishing a huge Bat Pattern, with the ideal D point at 29,962, which is confluent with the 38.2% Fibonacci retreatment of 2020-2022 move, just below the 30,000 handle. As such, the longer term outlook for Dow Jones bias to bearish. The path of least resistance of price may be lower.
DOW JONES DAILY CHART
Zooming in on the daily chart, however, Dow Jones remains in the defined range in recent days, with 32,734 (50% Fibonacci retreatment) and 31,766(38.2% Fibonacci retreatment) as the resistance and support respectively.
The prices have bounced off the lower band for the third time, suggesting the strength of support there. The RSI indicator turned lower below the neutral level, which can sometimes precede bearish momentum.
The immediate resistance looks to the upper band 32,734, a break from upside may open the door to the prior highs of 33,000 and 33.590.
On the flip side, the initial support looks to the lower band 31,766. A break below would guide the price back to the broader downtrend.

DowJones Tests And Initially Holds Its Equality TestIn this update we review the recent price action in the DowJones emini futures contract and identify the next high probability trading opportunities and price objectives to target

Dow Jones /YM : Potential Support Found at 50% Retracement/YM may find buyers at the 50% retracement level. Looking for longs with resistance based targets at 32650, 32900, 33200, 33500. Will update as this price action develops.

YM1! US30USD DOW 2023 Mar 13
YM1! US30USD DOW 2023 Mar 13
Short on reject of 32789 offered very good returns for those who were able to trade
during the US afternoon hours.
Ease of movement to the downside observed.
Possible scenarios:
1) Short on test and reject of 32789, possible target 31100
Volume Analysis:
Weekly: Ave vol down bar close toward low (non-trend changing)
Daily: Low vol E=R down bar (non-trend changing)
Price reaction levels
Short on Test and Reject | Long on Test and Accept
34689 32789
30513 28635
Remember to like and follow if you find this useful.
Have a profitable week ahead.

Five Waves Elliott Wave Structure in Dow Futures (YM)Cycle from 12.13.2022 high in Dow Futures (YM) shows a 5 swing sequence favoring follow up to the downside. Structure of the move lower from 12.13.2022 high is unfolding as a 5 waves diagonal Elliott Wave structure. Down from 12.13.2022 high, wave 1 ended at 32686 and rally in wave 2 ended at 34551. Dow Futures extends lower in wave 3 towards 32527 and wave 4 rally ended at 33590.
Internal subdivision of wave 4 unfolded as an expanded flat. Up from wave 3, wave ((a)) ended at 33211 and wave ((b)) pullback ended at 32527. Index then resumes higher in wave ((c)) with internal subdivision as 5 waves. Up from wave ((b)), wave (i) ended at 32785 and pullback in wave (ii) ended at 32580. Index then resumes higher in wave (iii) towards 33470, and pullback in wave (iv) ended at 33359. Final leg wave (v) ended at 33587 which completed wave ((c)) of 4 in higher degree. The Index has turned lower in wave 5 with internal subdivision as an impulse. Down from wave 4, wave ((i)) ended at 32626 and wave ((ii)) rally ended at 33002. Wave ((iii)) lower ended at 32190 and wave ((iv)) rally ended at 32534. Near term, as far as pivot at 33587 stays intact, expect rally to fail in 3, 7, 11 swing for further downside.

3rd Dimension Analysis. One dimension analysis or the depth analysis can be studying into the financial data of a the company.
. Two dimension analysis is when the investor or trader studying into the chart - Price & Time.
. Third dimension analysis is where we combine one and two dimension analysis.
Third Dimension Analysis = TA + Depth
Micro E-Mini Dow Jones
Contract value, $0.50 x DJIA Index
Micro E-Mini S&P
Contract value, $5 x S&P 500 Index
Micro E-Mini Nasdaq
Contract value, $2 x Nasdaq-100 Index
Micro E-Mini Russell
Contract value, $5 x Russell 2000 Index
Disclaimer:
• What presented here is not a recommendation, please consult your licensed broker.
• Our mission is to create lateral thinking skills for every investor and trader, knowing when to take a calculated risk with market uncertainty and a bolder risk when opportunity arises.
CME Real-time Market Data help identify trading set-ups in real-time and express my market views. If you have futures in your trading portfolio, you can check out on CME Group data plans available that suit your trading needs www.tradingview.com

Dow Jones: Periscope 👀Like a periscope, Dow Jones is craning its neck upwards, watching waves v in orange and (i) in blue unfolding before its eyes. To finish the current movement, the index should climb above the resistance at 35 521 points but ideally stop just short of the next mark at 36 446 points. Wave (ii) in blue should then lead Dow Jones decidedly back below 35 521 points. A 35% chance remains, though, for the index to turn downwards and to drop below the support at 28 635 points. In that case, Dow Jones would develop a new low in the form of wave alt.iv in magenta first before heading upwards again.

DowCBOT_MINI:YM1!
Can reach and fill the next channel
If it claoses above 33000-33100, can see another 200pt run

dowjones 4 hour say = above low,looking for buy when you see pinbar on 15-60-2240-1440min chart ,pick buy and put SL in pinbar low,uunderstand?
hold your buys minimum to fibo 50% (dont close soon)
if you have old buy ,dont fear ,dow will back to high ,but put hedge sellstop in low ok? (if it open,never close it in low ,even in 10.000$ profit(ca go downer and margincall you ),wait dow goes down and back ,up trend apear,then close sell,then on high close buys)
alert= dow will go to 35800 ,be carefull from sell 100% put sl
good luck
