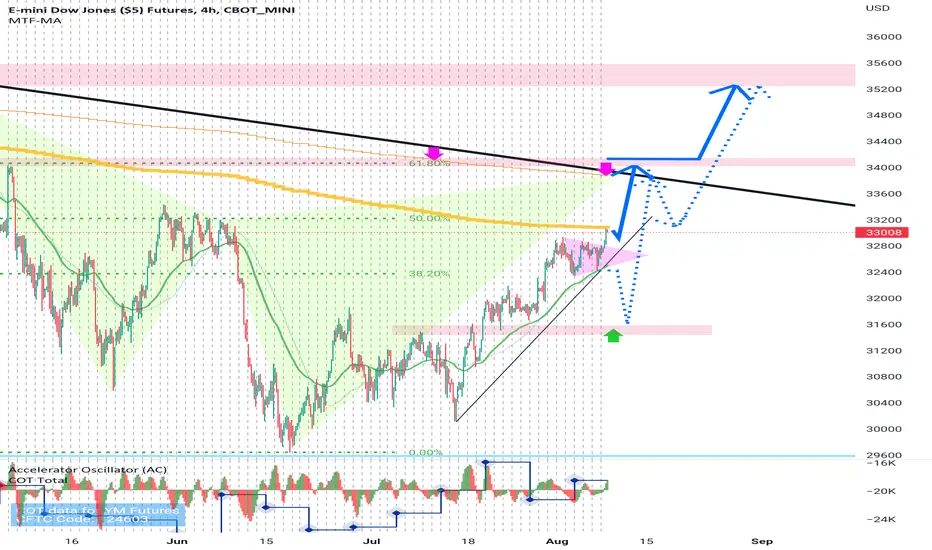
E-mini Dow Jones Futures (YM1!), H4 Potential for Bullish RiseType : Bullish Rise
Resistance : 35402
Pivot: 34029
Support : 33430
Preferred Case: On the H4, with price moving above the ichimoku indicator and along an ascending trendline, we have a bullish bias that price will rise from the pivot at 34029 where the pullback support is to the 1st resistance at 35402 in line with swing high resistance, -61.8% fibonacci expansion and 161.8% fibonacci extension .
Alternative scenario: Alternatively, price could break pivot structure and drop to 1st support at 33430 where the pullback support, 23.6% fibonacci retracement and 61.8% fibonacci projection are.
Fundamentals: Since investors have seen evidence that inflation has peaked, we have a bullish view on the dow jones index.
YM1! trade ideas

DowJones Momentum Divergence To Be AddressedIn this update we review the recent price action in the DowJones emini futures contract and identify the next high probability trading patterns and price objectives to target

DJI reversal pointI believe this should be reversing point for markets. DJI is currently at many confluence points and it should start wave C (sharp motive wave)

E-mini Dow Jones Futures (YM1!), H4 Potential for Bullish RiseType : Bullish Rise
Resistance : 35392
Pivot: 33445
Support : 32687
Preferred Case: On the H4, with price moving above the ichimoku indicator and along an ascending trendline, we have a bullish bias that price will rise from the pivot at 33445 where the pullback support is to the 1st resistance at 35392 in line with swing high resistance and 161.8% fibonacci extension .
Alternative scenario: Alternatively, price could break pivot structure and drop to 1st support at 32687 where the pullback support, 23.6% fibonacci retracement and 61.8% fibonacci projection are.
Fundamentals: Since investors have seen evidence that inflation has peaked, we have a bullish view on the dow jones index.

E-mini Dow Jones Futures (YM1!), H4 Potential for Bullish RiseType : Bullish Rise
Resistance : 35392
Pivot: 33445
Support : 32687
Preferred Case: On the H4, with price moving above the ichimoku indicator and along an ascending trendline, we have a bullish bias that price will rise from the pivot at 33445 where the pullback support is to the 1st resistance at 35392 in line with swing high resistance and 161.8% fibonacci extension.
Alternative scenario: Alternatively, price could break pivot structure and drop to 1st support at 32687 where the pullback support, 23.6% fibonacci retracement and 61.8% fibonacci projection are.
Fundamentals: Since investors have seen evidence that inflation has peaked, we have a bullish view on the dow jones index.

DOW 4hour : sell under red arrow after pinbar comes as predict before ,dow reach 33800 area (can touch 34000)
under 33800 we have powerful trendline , so after pinbar comes on 1hour,4hour or daily chart we can sell with SL= pinbar high
if you have old sell (why dont put SL on high ? here no SL=margincall and loss) near 33130 you must close all or hedge
good luck , if dow break trendline can fly up to 35200 (i belive dow going to back to top

For all traders in this market, especially buyers, For all traders in this market, especially buyers, the ban in the coming days, where a group of indicators indicating the price decline will meet, as the price rebounded on the resistance twice and a reversal candle was formed in addition to fading and equal to the last two columns of the (MACD) indicator
(YM)

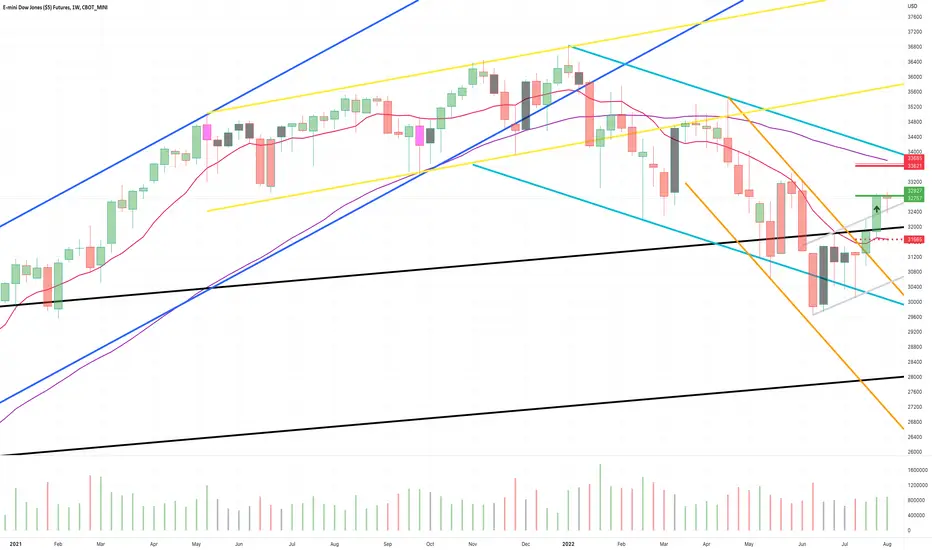
US30USD YM1! DOW 2022 AUG 15 Week
US30USD YM1! DOW 2022 AUG 15 Week
Last week market reached previous supply zone.
Long on retracement continues still preferred
Possible scenarios:
1) Continue of upward momentum for long on retracement
2) Short on rejection at channel supply
Price reaction levels
Short on Test and Reject | Long on Test and Accept
34807 34027 33205
Weekly: Ave vol up bar = minor strength
Daily: Ave vol up bar = minor strength
H4: Ave vol up bar = minor strength.
Remember to like and follow if you find this useful.
Have a profitable week ahead.

YM1! - Weekly Market Update, 8/15DJIA Futures have hit our projected bullish target.
Price is approaching the initial down trend structure formation and the 200 day SMA.
Two key things that need to be overcome in order for this market to grind higher.

DJIA (Ym1) - heading for a sub-corrective wave ivThe 6 months double three corrective wave has tentatively come to an end after a rebound was seen in Mid-June, with a potential sub-5 wave impulse move. As such, there are many opportunities to long/short accordingly.

Dow Jones: Wow Jones 😯Wow – sorry – Dow Jones has impressed us with some really fresh moves! It has virtually jumped upwards and thus has already come quite close to the upper orange zone between 33714 and 34565 points, where it should soon finish wave iii in orange. After completing a countermovement into the lower orange zone between 32863 and 31912 points, Dow Jones should continue to dow – sorry – wow us with more upwards action. To achieve this, though, it shouldn’t drop below the support at 31867 points.

DowJones Two Key Action Areas On WatchIn this update we review the recent price action in the DowJones emini futures contract and identify two high probability trade locations and price objectives to target

Dow 4 hour = fibo 61% show dow going to 34000exclent NFT news on friday , will push dow up this week !!!
if you have old sell , in deep hedge them and wait (never close buys frist)
strongly advice looking for buy , dont pick sell (only under red arrow +pinbar comes SL=pinbar high)
in 35200 we have powerfull support too , dow will see it too
i wish you win , stand on very very low and fix size
E-Mini Dow Jones Futures (YM1!), H4 Potential for Bullish RiseType : Bullish Rise
Resistance : 33432
Pivot: 32614
Support : 31864
Preferred Case: On the H4, with prices moving above the ichimoku indicator, we have a bullish bias that price will rise from the pivot at 32614 where the pullback support is to the 1st resistance at 33432 where the swing high resistance, -61.8% fibonacci expansion and 161.8% fibonacci extension are.
Alternative scenario: Alternatively, price could break pivot structure and drop to the 1st support at 31864 where the pullback support, 38.2% fibonacci retracement , -61.8% fibonacci expansion and 78.6% fibonacci projection are.
Fundamentals: Due to fresh worries of global growth, we have a bearish view on the Dow Jones Index. We'll need to exercise caution for this setup because our fundamentals and technicals are not completely aligned.

Mostly bearishBased on where the price is at I am mostly bearish at this point. I think the $33K is an important resistance point. Bulls need to push above $33k and the next week needs to be closed well above $33K to be bullish.

YM1! - Weekly Market Update, 8/8/22Dow Futures post a countertrend BUY signal ... Ideal entry, stop and target imaged on the chart.
Support and Resistance structures have been adjusted accordingly for your reference.
Wishing you a blessed and profitable week ahead.
Micro Dow Jones Futures (MYM1!), H4 Potential for Bullish RiseType : Bullish Rise
Resistance : 33429
Pivot: 32609
Support : 31859
Preferred Case: On the H4, with prices moving above the ichimoku indicator, we have a bullish bias that price will rise from the pivot at 32609 where the pullback support is to the 1st resistance at 33429 where the swing high resistance, -61.8% fibonacci expansion and 161.8% fibonacci extension are.
Alternative scenario: Alternatively, price could break pivot structure and drop to the 1st support at 31859 where the pullback support, 38.2% fibonacci retracement , -61.8% fibonacci expansion and 78.6% fibonacci projection are.
Fundamentals: Due to fresh worries of global growth, we have a bearish view on the Dow Jones Index. We'll need to exercise caution for this setup because our fundamentals and technicals are not completely aligned.

Micro Dow Jones Futures (MYM1!), H4 Potential for Bullish RiseType : Bullish Rise
Resistance : 33429
Pivot: 32609
Support : 31859
Preferred Case: On the H4, with prices moving above the ichimoku indicator, we have a bullish bias that price will rise from the pivot at 32609 where the pullback support is to the 1st resistance at 33429 where the swing high resistance, -61.8% fibonacci expansion and 161.8% fibonacci extension are.
Alternative scenario: Alternatively, price could break pivot structure and drop to the 1st support at 31859 where the pullback support, 38.2% fibonacci retracement, -61.8% fibonacci expansion and 78.6% fibonacci projection are.
Fundamentals: Due to fresh worries of global growth, we have a bearish view on the Dow Jones Index. We'll need to exercise caution for this setup because our fundamentals and technicals are not completely aligned.

E-MINI DOW JONES FUTURES (YM1!), H4 Potential for Bullish RiseType : Bullish Rise
Resistance : 33432
Pivot: 32602
Support : 31864
Preferred Case: On the H4, with price moving above the ichimoku indicator, we have a bullish bias that price will rise from our pivot at 32602 where the pullback support is to the 1st resistance at 33432 where the swing high resistance and -61.8% fibonacci expansion are.
Alternative scenario: Alternatively price could break pivot structure and drop to 1st support at 31864 where the pullback support, 38.2% fibonacci retracement and 78.6% fibonacci projection are.
Fundamentals: Due to fresh worries of global growth, we have a bearish view on the Dow Jones Index. We'll need to exercise caution for this setup because our fundamentals and technicals are not completely aligned.

Dow 4 hour = upper target is 34000above green arrow we can pick buy (after pinbar comes on 1hour or 4hour or daily chart with SL = 100 point TP=33800 (under trend line)
ADVICE = DONT PICK SELL , LOOKING FOR BUY IN DEEP WITH SL IN DAY LOW OR 100 POINT
good luck

Micro Dow Jones Futures (MYM1!), H4 Potential for Bullish RiseType : Bullish Rise
Resistance : 33432
Pivot: 32504
Support : 31864
Preferred Case: On the H4, with price moving along an ascending trendline and above the ichimoku indicator, we have a bullish bias that price will rise to our pivot at 32504 where the pullback resistance is. Once there is upside confirmation of price breaking pivot structure, we would expect bullish momentum to carry price to 1st resistance at 33432 where the swing high resistance and -61.8% fibonacci expansion are.
Alternative scenario: Alternatively, price could drop to 1st support at 31864 where the pullback support, 38.2% fibonacci retracement and 78.6% fibonacci projection are.
Fundamentals: Due to the House Speaker Nancy Pelosi's trip to Taiwan capital, Taipei, the Dow Jones Index is exposed to downside risk and we have a bearish view on the Dow Jones Index. We'll need to exercise caution for this setup because our fundamentals and technicals are not completely aligned.
