Micro Dow Jones Futures (MYM1!), H4 Potential for Bullish RiseType : Bullish Rise
Resistance : 33432
Pivot: 32504
Support : 31864
Preferred Case: On the H4, with price moving along an ascending trendline and above the ichimoku indicator, we have a bullish bias that price will rise to our pivot at 32504 where the pullback resistance is. Once there is upside confirmation of price breaking pivot structure, we would expect bullish momentum to carry price to 1st resistance at 33432 where the swing high resistance and -61.8% fibonacci expansion are.
Alternative scenario: Alternatively, price could drop to 1st support at 31864 where the pullback support, 38.2% fibonacci retracement and 78.6% fibonacci projection are.
Fundamentals: Due to the House Speaker Nancy Pelosi's trip to Taiwan capital, Taipei, the Dow Jones Index is exposed to downside risk and we have a bearish view on the Dow Jones Index. We'll need to exercise caution for this setup because our fundamentals and technicals are not completely aligned.
YM1! trade ideas

E-MINI DOW JONES FUTURES (YM1!), H4 Potential for Bullish RiseType : Bullish Rise
Resistance : 33437
Pivot: 32495
Support : 31864
Preferred Case: On the H4, with price moving along an ascending trendline and above the ichimoku indicator, we have a bullish bias that price will rise from our pivot at 32495 where the pullback support is to the 1st resistance at 33437 where the swing high resistance and -61.8% fibonacci expansion are.
Alternative scenario: Alternatively price could break pivot structure and drop to 1st support at 31864 where the pullback support, 38.2% fibonacci retracement and 78.6% fibonacci projection are.
Fundamentals: Due to fresh worries of global growth, we have a bearish view on the Dow Jones Index. We'll need to exercise caution for this setup because our fundamentals and technicals are not completely aligned.

DowJones Two Way Trading Opportunities In this update we review the recent price action in the DowJones futures contract and identify the next high probability trading opportunities and price objectives to target

US30USD YM1! DOW 2022 AUG 01 Week
US30USD YM1! DOW 2022 AUG 01 Week
Last week market reached previous supply zone. Long on retracement continues.
And if price broken down of channel is is rejected,
target could be 30406.
Possible scenarios:
1) Continue of upward momentum for long on retracement
3) Rejection at previous supply zone + breakdown of channel for short
Price reaction levels
Short on Test and Reject | Long on Test and Accept
32563 31867
30406 29639 26212
Weekly: Ave vol up bar close at high = strength
Daily: Ave vol up bar close off high = minor weakness
H4: High vol narrow spread up bar followed by ave vol up bar close off high = weakness
Remember to like and follow if you find this useful.
Have a profitable week ahead.

YM1! - Weekly Market Update, 8/1/22Dow Futures post a countertrend BUY signal ... Ideal entry, stop and target imaged on the chart.
Support and Resistance structures have been adjusted accordingly for your reference.
Wishing you a blessed and profitable week ahead.

Elliott Wave View: Dow Futures (YM) May Pullback SoonShort Term Elliott Wave view in Dow Futures (YM) suggest that rally from 6.17.2022 low is unfolding as a double three Elliott Wave structure. Up from 6.17.2022 low, wave W ended at 31867 and dips in wave X ended at 30109. Internal of wave X unfolded as a zigzag structure. Wave ((a)) ended at 30331, wave ((b)) ended at 31490 and wave ((c)) lower ended at 30109. This completed wave X in higher degree. Wave Y is in progress with internal subdivision as a zigzag structure.
Up from wave X, wave (i) ended at 30726 and dips in wave (ii) ended at 30495. Index extends higher in wave (iii) towards 31264, wave (iv) ended at 31113, and final leg higher wave (v) ended at 31614 which completed wave ((a)). Pullback in wave ((b)) ended at 30949. Wave ((c)) higher is in progress as a diagonal. Up from wave ((b)), wave (i) ended at 31980 and pullback in wave (ii) ended at 31504. Index then extends higher towards 32193 to end wave (iii). Expect wave (iv) pullback to end soon, and Index should resume higher in wave (v) of ((c)) to end wave Y. Potential target higher is 100% – 161.8% Fibonacci extension of wave W from 6.17.2022 low. This area comes at 32321 – 33691 where sellers can appear for further downside or 3 waves pullback at least.

MYM - Daytrading - Micro E-mini Future Dow JonesTrade #1 - At the opening, some seconds after 9h30
This Short trade is executed on the premise that before the open the trend is down as shown by the indicators presented at the at the bottom pane
Because of the normal velocity at the open, the Lmt target order is put at at the lowest visible location in 15 minutes period
The Stop order is adjusted over previous heikin-ashi candle, but in 5 minutes period beginning at 9h35, and so on...
When closing the position as the target is reached, this trade gave 120 points, or ~60$ for one contract.
At this 9h30 opening time we can trade easily morey contracts if we want, as the high volume is there.
But we must be aware of the losses we are ready to assume...

Showcase: A quick trade on e-mini Dow Jones (YM, 25 July 2022)I recorded the video abit late:
There was a nice pullback formation earlier and if you look on the left side of the chart, you can see the price was on downtrend before it made a reversal with high vol. (indicated in the video as SO, which is actually an SP based on the bar characteristics).
I did set my EP at 31282 but the price volatility caught me off guard and I emotionally entered on market price. Eventually price went down to capture my earlier EP level before continue moving upwards.
We managed to exit with 25pts profit for holding of less than 10mins. This shows that having a proper background and entry on Pullback would yield a good return; bear in mind that in Futures, you need to enter in and out quickly.

My expectations for fed dayI would expect that they will take the market higher today on monday, to dump it hard on tuesday during the FED and FOMC announcements.

US30USD YM1! DOW 2022 JULY 25 Week
US30USD YM1! DOW 2022 JULY 25 Week
Last week's long preference worked well.
Weakness shown over 3 TF analysis. We may see
short opportunity temporarily.
Possible scenarios:
2) Market rotation = trade at boundary of range
3) Behavior change scenario
Price reaction levels
Short on Test and Reject | Long on Test and Accept
32563 31867
30406 29639 26212
Weekly: Ave vol up bar close off high = weakness
Daily: Ave vol UT bar = weakness
H4: Ave vol tiny spread up bar = weakness
Remember to like and follow if you find this useful.
Have a profitable week ahead.

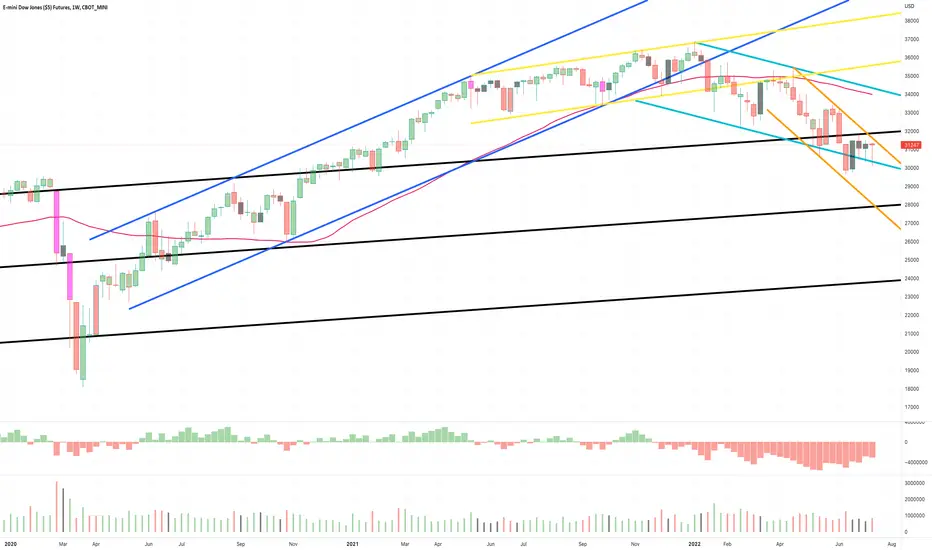
YM1! - Weekly Market Update, 7/25Dow futures remain contained this week by 2 channel formations.
Price action tested the GREY channel and failed to close above the BLACK channel.
Channel structures have been adjusted accordingly for your reference.

Dow failure, so far, to breakout.The possible fly in the ointment for the major index's breakout of trading range.

DowJones Targeting the Equality Objective & HVNIn this update we review the recent price action in the DowJones futures contract and identify the next high probability trading opportunity and price objectives to target

E-MINI DOW JONES ($5) FUTURESGood ascent but faced very strong resistance and start coming down and we can watch it at the bottom call.

DowJones Trading The Range BreakIn this update we review the recent price action in the DowJones futures contract and identify the next high probability trading opportunity and price objectives to target

US30USD YM1! DOW 2022 JULY 18 Week
US30USD YM1! DOW 2022 JULY 18 Week
Last week, rotation strategy worked well again. Point to note for Dow, unlike
NASDAQ and SNP, we didn't see bullish volume returning.
So we will still adopt the rotation strategy.
Also with minor strength on Weekly tf, we can also look for long oppportunity
on retracement.
Possible scenarios:
2) Market rotation = trade at boundary of range
3) Behavior change scenario
4) Trend continuation - channel boundary trades
Price reaction levels
Short on Test and Reject | Long on Test and Accept
32563 31867
30406 29639 26212
Weekly: Ave vol down bar close toward high = minor strength
Daily: Ave vol u bar close at high = minor strength
H4: Very high vol narrow spread up bar close off high
followed by ave vol tiny spread up bar = weakness
Remember to like and follow if you find this useful.
Have a profitable week ahead.

YM1! - Weekly Market Update, 7/18/22Dow Futures remain bound by support below and resistance above which leaves us little to no opportunity to confirm a trade idea for this upcoming week.
Support and resistance structures have been adjusted accordingly for you review and reference.
I do not see any actionable ideas at this time. I will update midweek if need be.
Wish you many blessings and much prosperity!
MYM Micro E-mini Future Dow Jones2022-07-14
MYM swing trading
Trade #17 3 ctr Short
If Stop + 183 $
If Lmt + 1 832 $

US30 Potential bullish bounce | 15th July 2022On the H4, with price expected to bounce off the stochastics indicator, we have a bullish bias that price will rise from our 1st support at 30423 where the horizontal pullback support is to our 1st resistance at 31477 in line with the horizontal swing high resistance and 78.6% Fibonacci retracement. Alternatively, price may not break 1st support and head for 2nd support at 30116 where the horizontal swing low support is.
Please be advised that the information presented on TradingView is provided to Vantage (‘Vantage Global Limited’, ‘we’) by a third-party provider (‘Everest Fortune Group’). Please be reminded that you are solely responsible for the trading decisions on your account. There is a very high degree of risk involved in trading. Any information and/or content is intended entirely for research, educational and informational purposes only and does not constitute investment or consultation advice or investment strategy. The information is not tailored to the investment needs of any specific person and therefore does not involve a consideration of any of the investment objectives, financial situation or needs of any viewer that may receive it. Kindly also note that past performance is not a reliable indicator of future results. Actual results may differ materially from those anticipated in forward-looking or past performance statements. We assume no liability as to the accuracy or completeness of any of the information and/or content provided herein and the Company cannot be held responsible for any omission, mistake nor for any loss or damage including without limitation to any loss of profit which may arise from reliance on any information supplied by Everest Fortune Group.

DowJones Testing Pivotal SupportIn this update we review the recent price action in the DowJones futures contract and identify the next high probability trading opportunities and price objectives to target


US30 H4 Potential Bounce | 13th JuLY 2022On the H4, with price moving above the ichimoku cloud, we have a bullish bias that price will rise from our 1st support at 31218 where the horizontal pullback support is to our 1st resistance at 31866 in line with the horizontal swing high resistance. Alternatively, price may not break 1st support and head for 2nd support at 30434 where the horizontal swing low support is.
Please be advised that the information presented on TradingView is provided to Vantage (‘Vantage Global Limited’, ‘we’) by a third-party provider (‘Everest Fortune Group’). Please be reminded that you are solely responsible for the trading decisions on your account. There is a very high degree of risk involved in trading. Any information and/or content is intended entirely for research, educational and informational purposes only and does not constitute investment or consultation advice or investment strategy. The information is not tailored to the investment needs of any specific person and therefore does not involve a consideration of any of the investment objectives, financial situation or needs of any viewer that may receive it. Kindly also note that past performance is not a reliable indicator of future results. Actual results may differ materially from those anticipated in forward-looking or past performance statements. We assume no liability as to the accuracy or completeness of any of the information and/or content provided herein and the Company cannot be held responsible for any omission, mistake nor for any loss or damage including without limitation to any loss of profit which may arise from reliance on any information supplied by Everest Fortune Group.

Potential Bullish ContinuationOn the H4, with price moving in an ascending trendline on the RSI, we have a bullish bias that price will continue to rise from the pivot at 30821 in line with the pullback support and 61.8% fibonacci retracement to the 1st resistance at 31852 at the swing high in line with the 61.8% fibonacci projection and 50% fibonacci retracement. Alternatively, price may break the support structure at the pivot and drop to the 1st support at 30405 the multiple swing low in line with the 61.8% fibonacci projection
Any opinions, news, research, analyses, prices, other information, or links to third-party sites contained on this website are provided on an "as-is" basis, as general market commentary, and do not constitute investment advice. The market commentary has not been prepared in accordance with legal requirements designed to promote the independence of investment research, and it is therefore not subject to any prohibition on dealing ahead of dissemination. Although this commentary is not produced by an independent source, FXCM takes all sufficient steps to eliminate or prevent any conflicts of interest arising out of the production and dissemination of this communication. The employees of FXCM commit to acting in the clients' best interests and represent their views without misleading, deceiving, or otherwise impairing the clients' ability to make informed investment decisions. For more information about the FXCM's internal organizational and administrative arrangements for the prevention of conflicts, please refer to the Firms' Managing Conflicts Policy. Please ensure that you read and understand our Full Disclaimer and Liability provision concerning the foregoing Information, which can be accessed on the website
