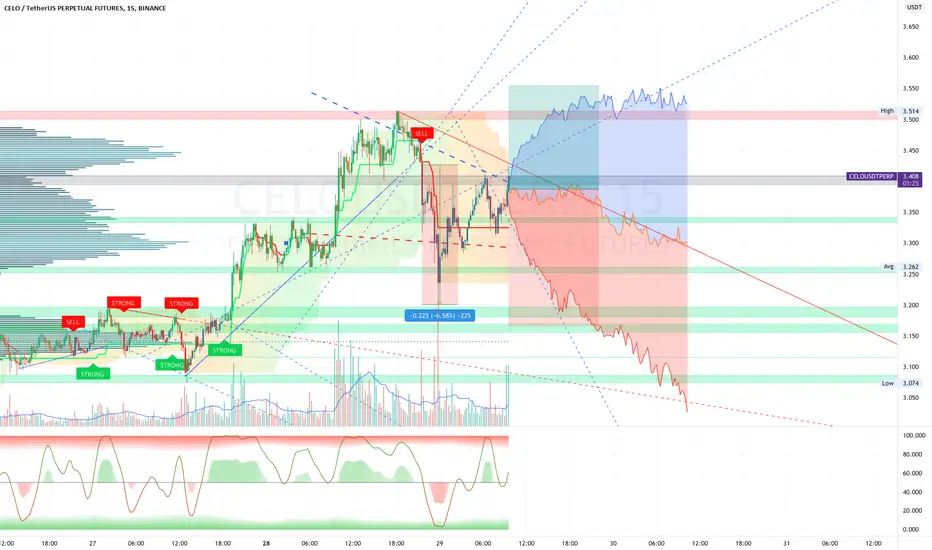
CELO long scalpquick long scalp, we need more volume in to it but looks good for continuation to the upside. PA is decent here, lets see
NOT A FINANCIAL ADVICE
POSTING THIS JUST FOR EDUCATIONAL PURPOSES
CELOUST trade ideas


CELOUSDT SETUPCELOUSDT price trying to gain momentum after bouncing from a good support area if momentum sustain we could see an upward surge.

CELO - On interesting zone depending on TA Hello trading friends,
CELO - On interesting zone depending on TA for long trend.
We could see some interesting trends coming time - on this way it's also interesting to watch it out.
Trade only depending on your setups.
Have a good time.

CELO triangle breakoutCheck CELO and you will see brake of resistance line. Try to get some cheap tokens on re-test from above and run to $3.49

CELO is demonstrating an integrating bullish patternCELO price action is reflecting the higher-lows formation near below the crucial $3.20 resistance level.
The CELO bulls are well maintaining the coins price above the 20 and 50-day moving averages in terms of the daily price chart.
CELO holders are holding the price well above the 20 and 50-day EMAs on the daily price chart. Above the critical resistance area, the remaining 100 and 200-EMAs are likely to influence the directional trend.
Stoch RSI is seeing an overbought phase on the daily price chart. Recently, the moving line gave a bullish crossover and again continued to move towards the 100-level.
The Average directional index is appearing higher at 28-mark, reflecting the bullish momentum for the CELO coin.
The bulls need to push the price of the CELO token above the nearest resistance area of $3.20. On the other hand, if the bulls fail to manage the price above the previous swing low of $2.77, the bulls may again look for selling opportunities.
Support level- $2.80 and $2.0
Resistance level- $3.20 and $4.4

Celo/usdt Free SignalCelo/usdt Buy -$2.86
Target 1 -$3.20
Target 2 -$4.5
Target 3-$6
Stop lose-$2.6
We Are Stop Lose For Minimum Losses

LONGGG WAITREADY?
Trend line wave may change anytime so long term prediction might be invalid....go for short term

CELO, PUMP after a HUGE accumulation?After a false level breakout and liquidity collection, Celo now continues to rise.
A break up from such a huge accumulation zone could lead the price to a big PUMP.
The target for the global move is $4.7-5. Here is the nearest value zone and the psychological $5 level. At this price, most traders will close their positions and the price can pull back temporarily.
Friends, push the like button, write a comment, and share with your mates - that would be the best THANK YOU.
P.S. I personally will open entry if the price will show it according to my strategy.
Always make your analysis before a trad


CELO / USDTI try to provide analyzes with a specific time area
Please note the expiration time.
always Be faithful to the SL.

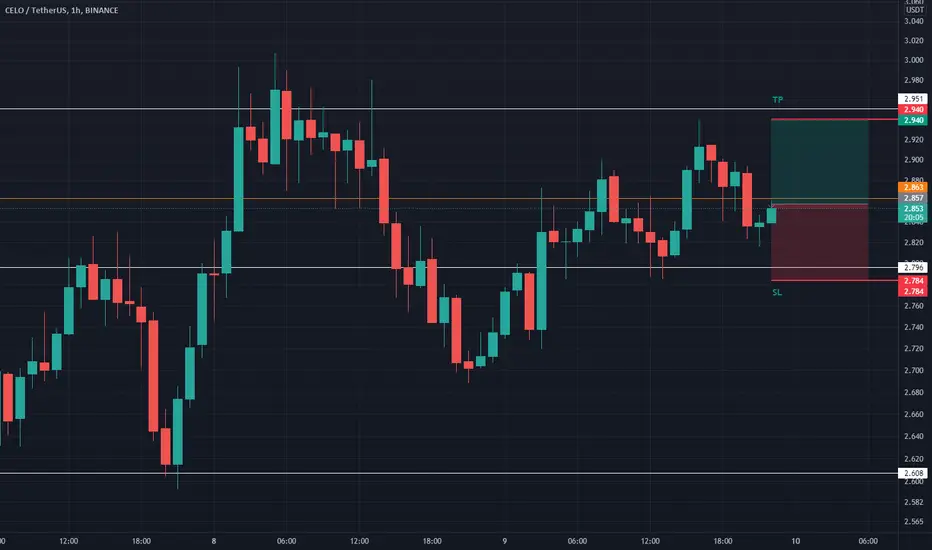
CELOUSDT (Long)CELOUSDT in an upward trend, making higher highs and higher low. The price is bouncing off its strong 4 hourly support level
Long
Entry at 2.858
Take Profit at 2.940
Stop loss at 2.784
Risk/reward ratio of 1:1.14
CELO breaking out of descending wedgebreakout with increasing volume. this looks ready for a big move up

$CELO on watch to close above $3 on the weeklyIf this manages to close above $3, I'll be entering long!

CELO LOOKING PROMISINGit's a very simple trend analyses on time frame : daily
having broken the recent reliable trend very nicely one can say we have big gain ahead of us but it all depends on the momentum of market
so put your stop loss and take profit levels wisely.
have a good one
and as always make a choice.
good luck *(whatever that means)

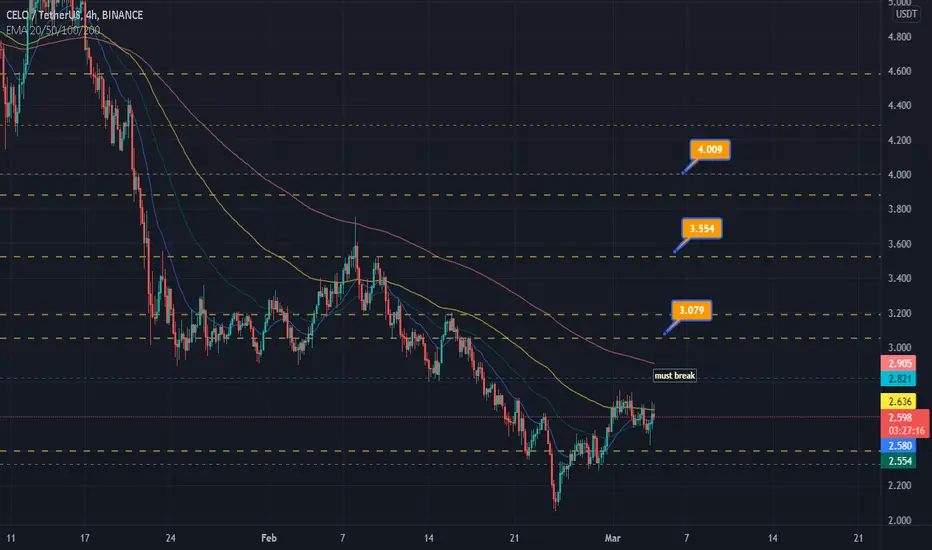
CELO USDT Observation>>>>>>>>>>>>>>>>>Hello Everyone
Based on the chart.CELO was able to get ready to hitting the resistance's by high power
This is not all, and CELO will find the potential to reach higher prices by updating the network(Fundamentals). (You can read abut programs in site)
Currently engaged in daily time frame with 20-day MA and 100-day MA resistance at 4-hour time frame.
So We Can Expect To Hitting Our price Goal's.
I Have Tried My Best to Bring the best Possible outcome in this Chart
PLZ RDOR
With Good Hopping>>>>>>>>>>>>>>>>>>>>>>>>>>>>>>>>>>>>>>>>>>>>>>>>>>>>>>>>
CELO - the buy level for the investmentHello, everyone!
The new heading - where is the bottom for altcoins! Let's get started with the CELO coin.
The Fibonacci retracement for the last downside impulse was corrected exactly to the 0.61 Fib. In this case the final downside target is the Zone 27 $1.83 - $2.25. There will be very nice accumulation zone to enter the position.
Good luck!
DISCLAMER: Information is provided only for educational purposes. Do your own study before taking any actions or decisions at the real market.

Celo Usdt Long Swing | CELOUSDT | LONG @ 3.06 - 3.12 | TP @ 3.15, 3.18, 3.2, 3.22, 3.25 | SL @ 2.75 | PATTERN = WHITE MARUBOZU | KUCOIN |
Swing trade idea. Kindly follow targets and stop loss. Will update with new targets once all 5 are achieved.


CELOUSDTHello Crypto Lovers,
Mars Signals team wishes you high profits.
We are in the 4-hour time frame. The price has broken our S1 line and we are Short on CELO. However, if the price breaks the R1 line our scenario would have failed. The S1 line has not been able to support the price during the previous candles. It seems that the price is retesting the broken S1 line. If it stays below the R1 line then you can enter Short.
Warning: This is just a suggestion and we do not guarantee profits. We advise you to analyze the chart before opening any positions.
Wish you luck
